

1. Double click on PAGE.bat
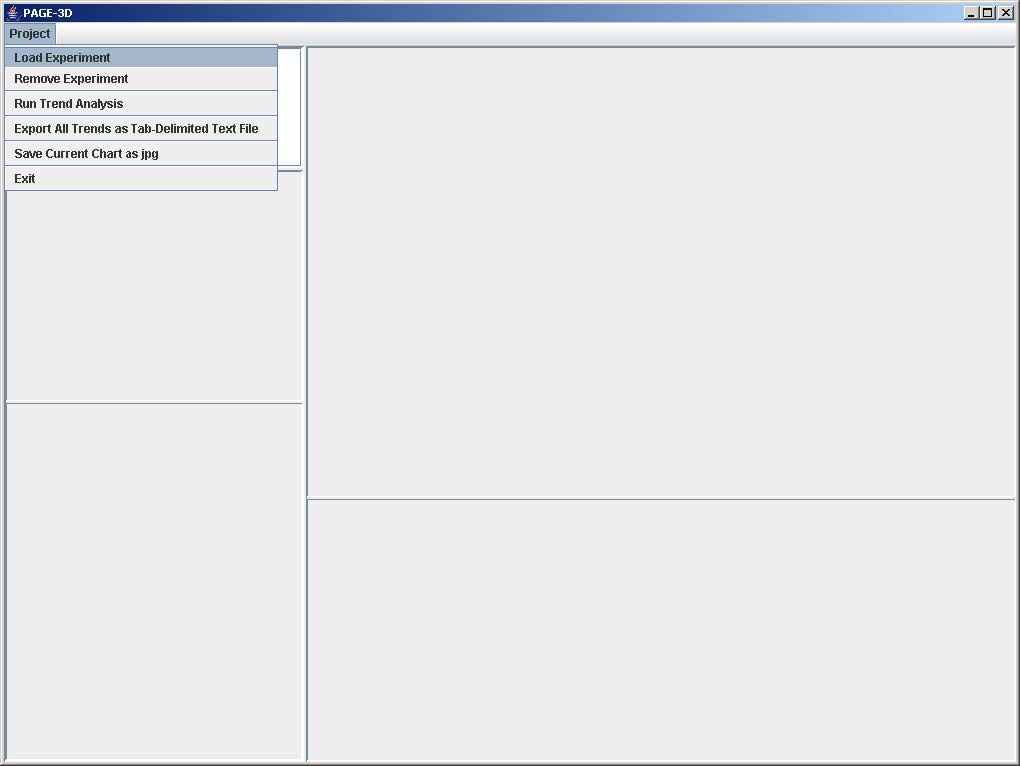
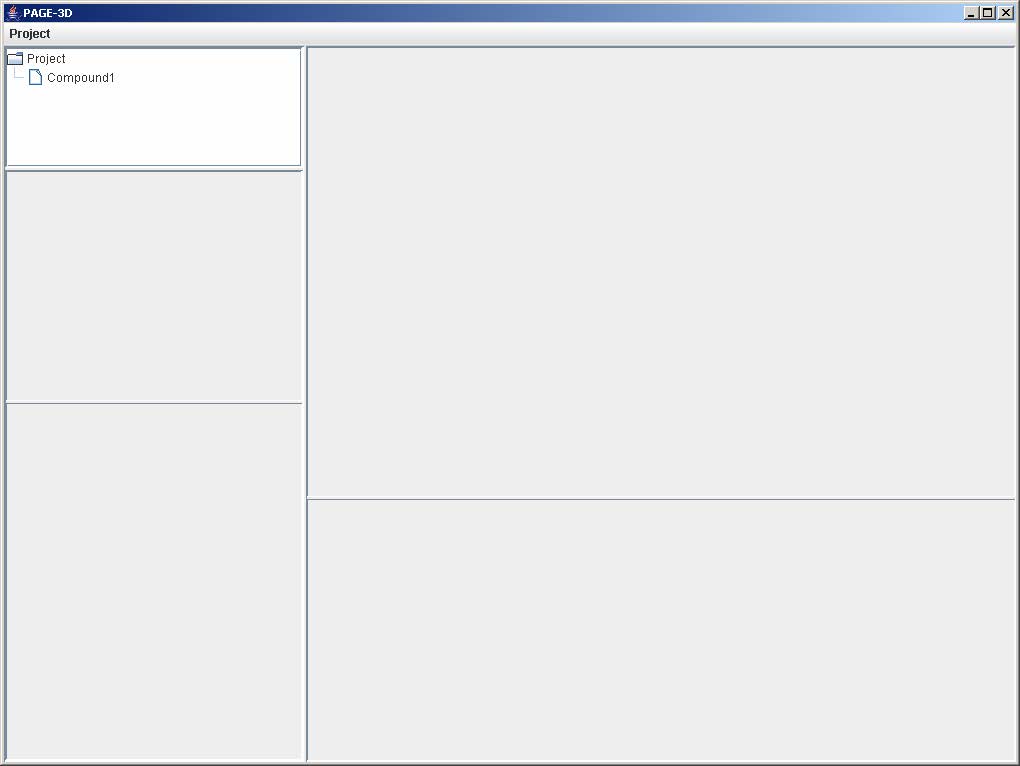
2. Click on Project and select Load Experiment
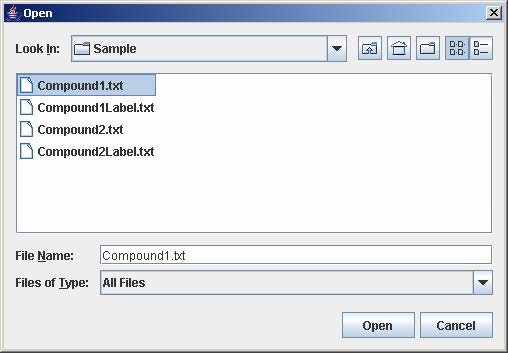
3. Select Compound1.txt and click Open
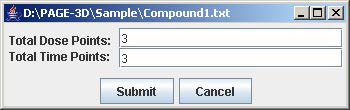
4. Enter 3 for total dose points and total time points. Then, click Submit
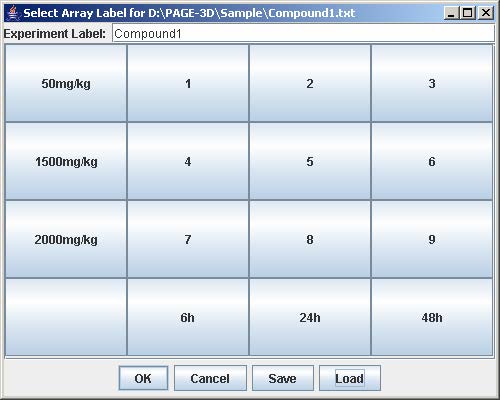
5. Click on Load
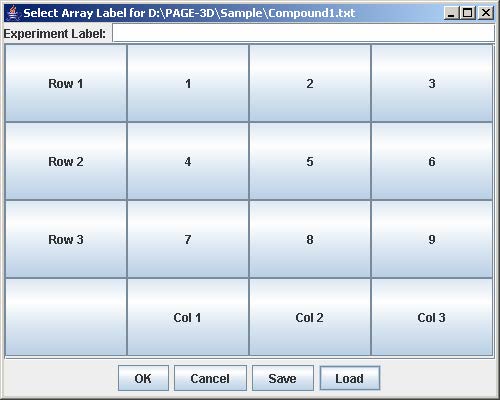
6. Select Compound1Label.txt and click Open
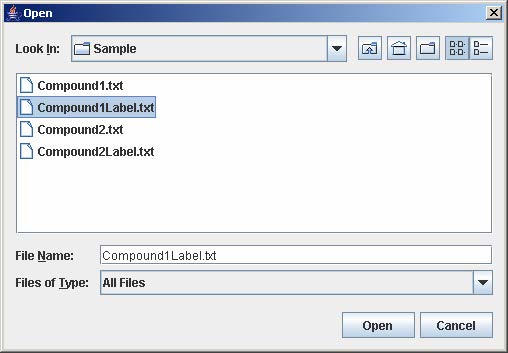
7. Click OK
8. Click on Project and select Load Experiment again
9. Select Compound2.txt and click open
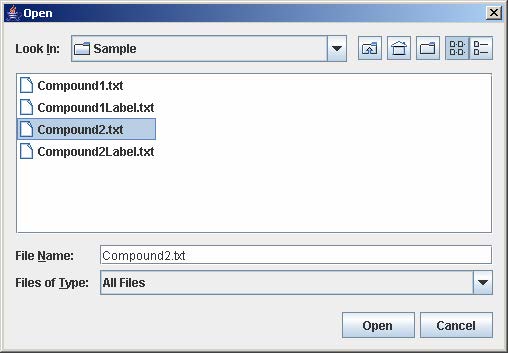
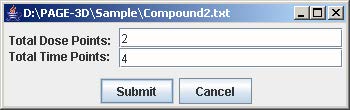
10. Enter 2 for total dose points and 4 for total time points. Then, click Submit
11. Click on Load
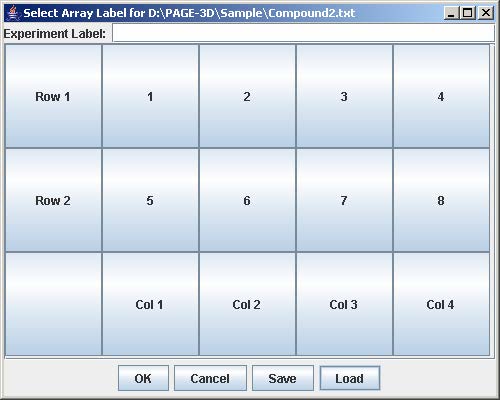
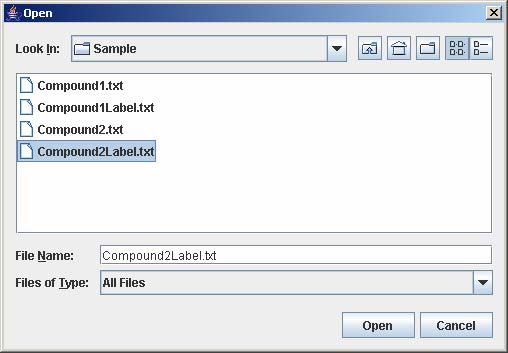
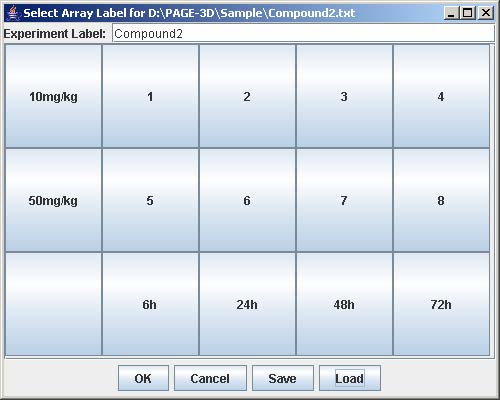
12. Select Compound2Label.txt and click Open
13. Click OK
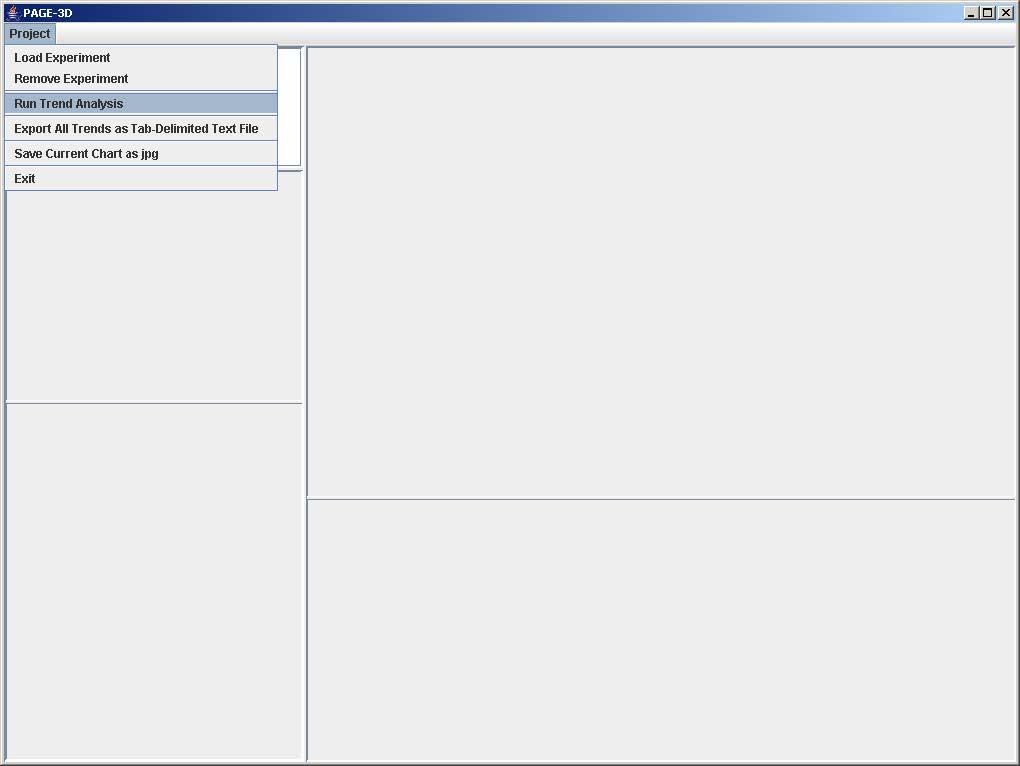
14. Click on Project and select Run Trend Analysis
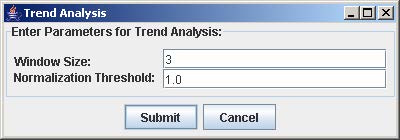
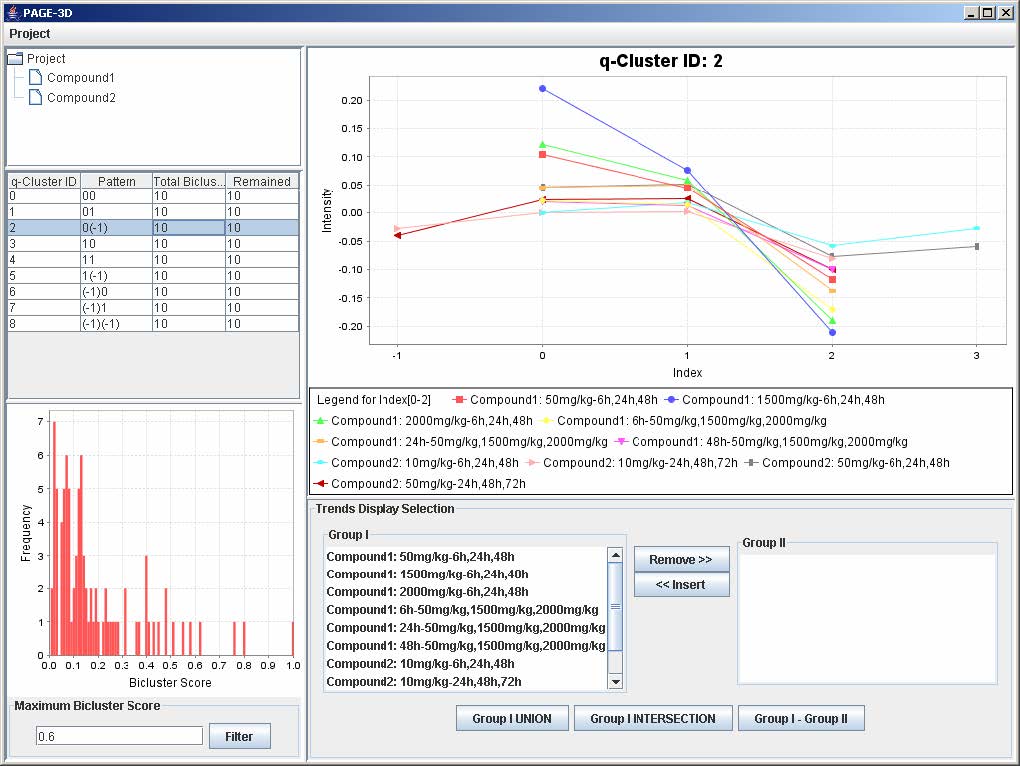
15. Enter 3 for window size. Then, click Submit
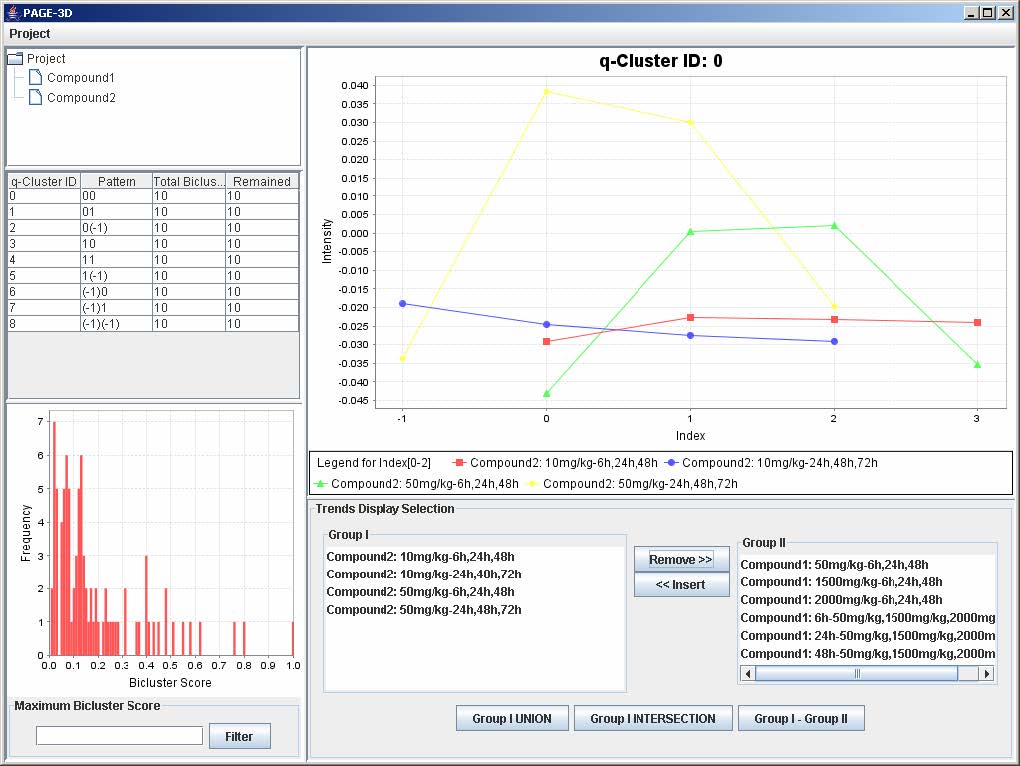
16. Select all the trends form Compound1 in the Trend Display Selection Panel
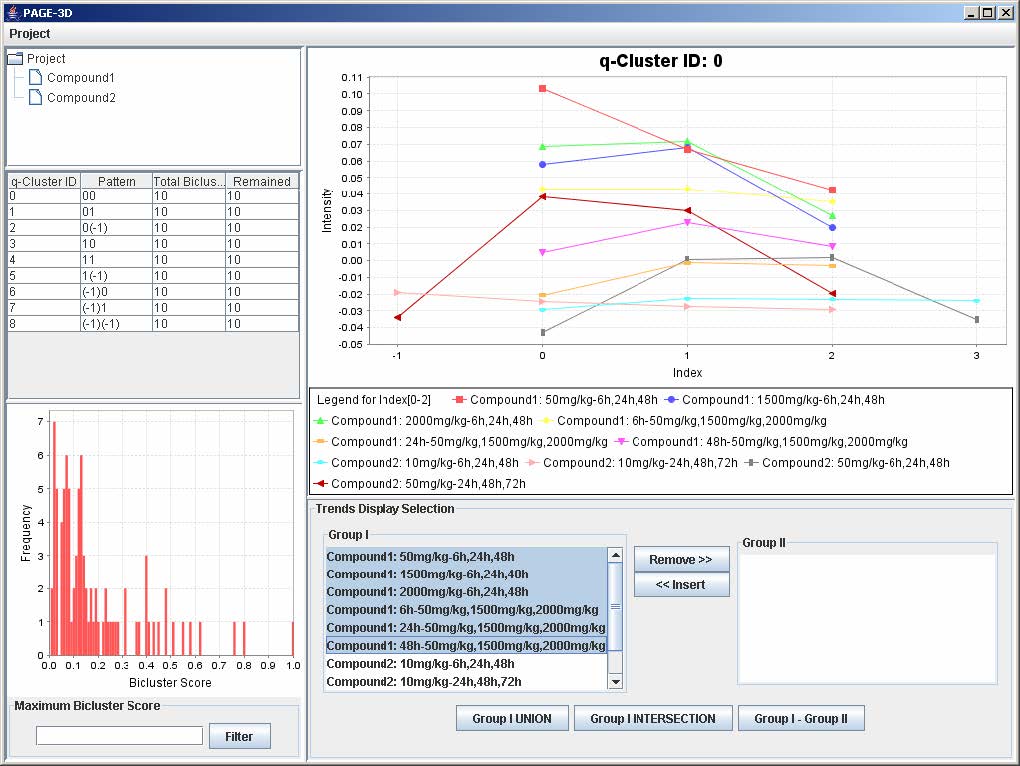
17. Click the "Remove>>" button

18. Click on the “Group I Union” button
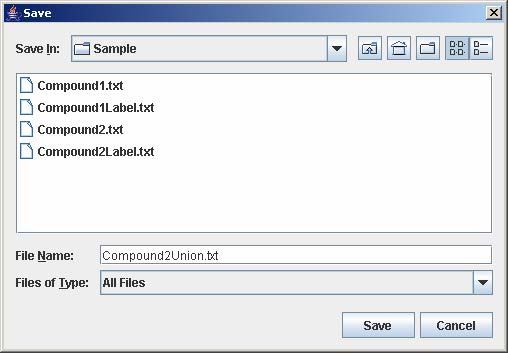
19. Click on File and select Save As Tab-Delimited
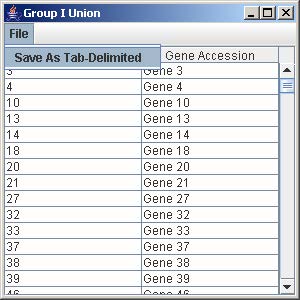
20. Enter Compound2Union.txt and click Save.
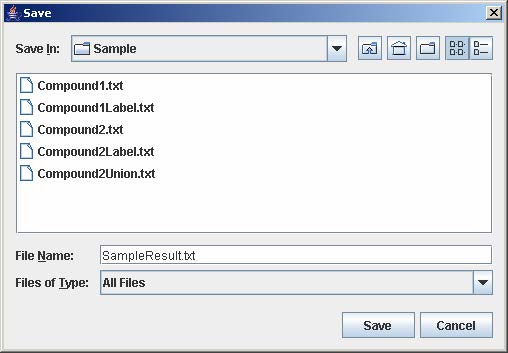
21. Click on Project and select Export All Trends as Tab-Delimited Text File

22. Enter SampleResult.txt and click Save
23. Click on Project and select Save Current Chart as jpg
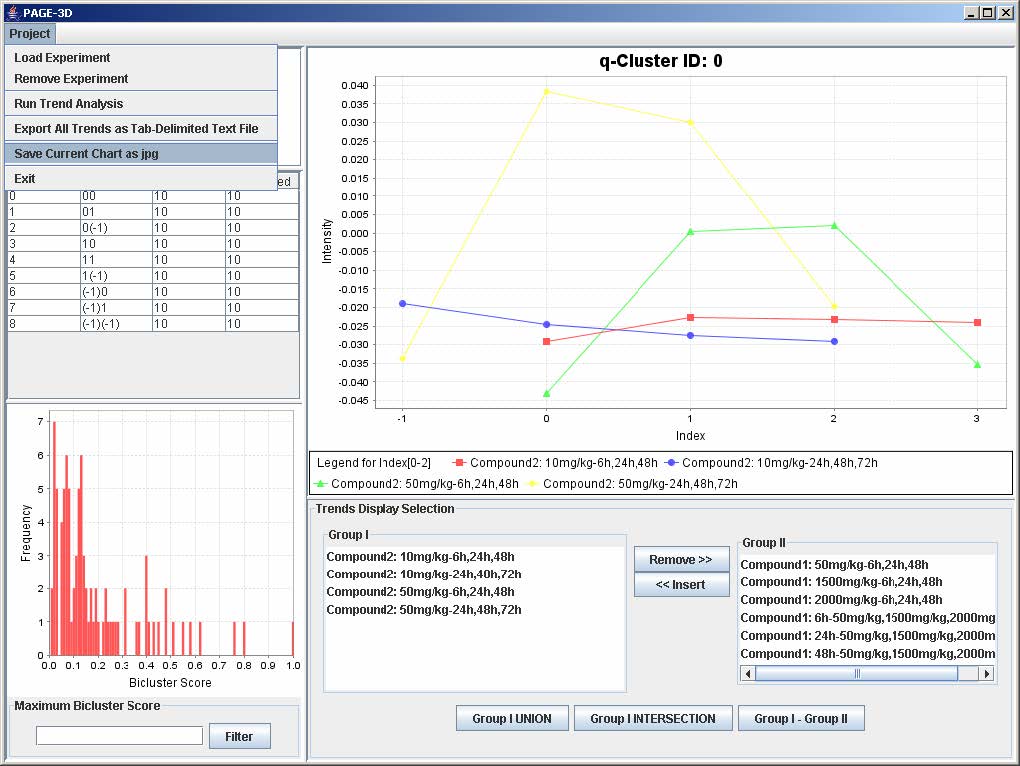
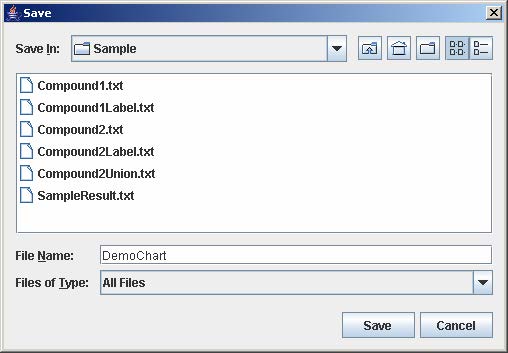
24. Enter DemoChart and click Save
25. Enter 0.6 for Maximum Bicluster Score in the lower left panel and click Filter

26. Click on q-ClusterID 2 in the Table listing the q-Cluster Ids.
27. Click on Project and select Exit.
