

This document's organization
This help file is organized in a tutorial manner to guide users through specific tasks, and does not specifically explain every detail of the program. Menu items are noted as choice:choice:choice; for instance, File:Open:Spectrum will indicate choose File then Open then Spectrum. Dialogue buttons are noted as enclosed in brackets, for instance [OK] indicates the OK button.
Introduction, Requirements, Installation
PEST WinSIM is designed to compute the simulations of multiple species of isotropic EPR spectra. Up to 10 independent EPR signals each with up to 16 sets of hyper fine couplings can be calculated. Experimental spectra may be loaded for on-screen comparisons. A custom algorithm (LMB1) and the Simplex algorithm have been implemented to optimize the simulation to achieve the best possible fit with the experimental signal.
Requirements
PEST WinSIM requires one of the following systems:
- Windows NT (intel only)
- Windows 95
- Windows 3.11 + Win32s libraries (not included with distribution)
No additional memory or hard disk requirement is anticipated.
Installation
Check the main PEST documentation
System Preferences
On start up, PEST WinSIM reads preferences from the niehs.ini file located in the Windows root directory. Other programs from the NIEHS may also access this file. Use Edit:Preferences to customize the program for your needs:
| Start up Project | Defines default spectra and/or parameters to be opened when WinSIM is started if these options are selected. Click on [Save_now] to save the current spectra and/or parameters as defaults and [Open_now] to reload the default data. |
|---|---|
| The Temp directory | Is the location for default data files for import/export exchange with the EPR.EXE program. This is normally C:\LAB\EPRDATA. |
| Help Browser | Refers to your WWW viewer, such as Netscape. Enter the full path so that WinSIM can start the browser for viewing help files and the Spin Trap Database. |
| Help File | Refers to the HTML format help files that are part of the PEST distribution. A user may access them either over Internet directly from the NIEHS or install them onto her own hard disk. The current Internet address for these files was http://alfred.niehs.nih.gov/LMB/pest/manual. A typical hard disk address might be c:\lab\docs\manual. Since the first document is named home.html, a user only needs to enter the path of the directory. |
Opening and Saving Data Files
The File:Open:Import function allows quick interchange with the DOS mode EPR.EXE program. The EPR.EXE program contains many more spectrum processing, measurement, and output options. Spectrum files are written to a temporary directory and located by number. For instance, in the DOS program, export the spectrum as #1, and in the WinSIM program import the same spectrum as #1. the user can also export from WinSIM and import into EPR.EXE.
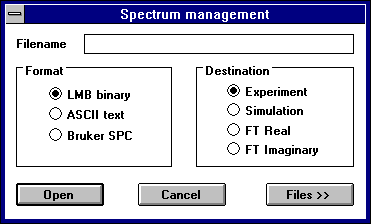
The File:Open:Spectrum function is the primary means for loading new spectrum files into the program. The following types of files can be loaded.
- NIEHS binary from the PEST programs
- spc/par from the Bruker OS/9 system
- ASCII text columns
A Dialogue box will prompt the user for the filename. By default, the spectrum will be loaded as the experimental continuous wave spectrum. However, the user may choose in the filename Dialogue box to load the spectrum as either FT Real, FT Imaginary, or CW simulation
The File:Open:Project function groups spectrum and parameter files together with a single base filename. This allows the user to save and recall an experimental spectrum, the simulated spectrum, and the parameters at once. Filename extensions are used to denote the different types of data:
| .lmb ---- | experimental spectrum file (NIEHS binary format only) |
|---|---|
| .sim ---- | simulated spectrum file (NIEHS binary format only) |
| .out ---- | ASCII version of parameters file, calculated parameters only |
| .epr ---- | ASCII printout file of simulation parameters |
| .sdx ---- | parameters file including all parameters |
By default, only the .lmb, .sim, and .sdx files are saved and opened. The user can select any set of these files to open and save. Therefore, the user can choose to load only the parameters from a project, for instance. Note that the extensions cannot be changed.
Chose File:New to erase the current spectrum data. This will not affect the current simulation parameters.
File saving works the same as file opening. If a spectrum file is opened, the current simulation parameters are not disturbed. If simulation parameters are opened, the current spectrum data is not disturbed.
Spectrum Information
Once a spectrum is opened, choose Edit:Information to check the number of data points, scan range and field center, and other instrumental parameters.
Copying spectra to the Windows clipboard
PEST WinSIM will copy data to the Windows clipboard, which the user may employ to paste the data into a spreadsheet style program such as Microcal Origin or Microsoft Excel for custom manipulations. Choose Edit:Copy_data and the current spectra displayed will be formatted into multiple data columns for pasting into a spreadsheet control. Pasting from the clipboard into the spectra arrays is not supported.
Controlling the Spectrum Display
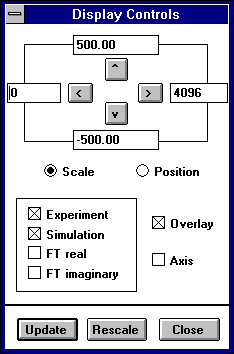
The user may refresh the screen display with the Display:Plot command. Use Display:Rescale to automatically scale a spectrum plot which is too large or too small for the display area. Use Display:Overlay to switch between plotting multiple spectra as overlapped or separate lines.
Select Display:Display to further control the spectrum screen plotting. A dialogue box appears with entries for the left, right, bottom, and top values of the plotting area ; selections for which spectrum data to plot ; whether or not to overlay the plots ; and to show the x and y axis. To zoom into or out-of the plot, click on the arrow buttons [<][>]and switch between scale movements or position movements. The X scale is shown as datapoints and the Y scale is shown as program plotting units; the default Y scale is the same as the DOS EPR.EXE program (+/- 500).
Spectrum Manipulations
Controlling the spectrum display
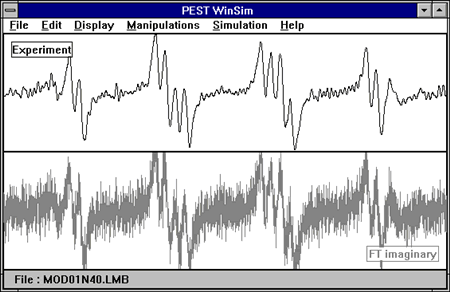
Spectra may be filtered by selecting Manipulations:Filter. The experimental spectrum will undergo an FFT to separate its frequency components and the Real and Imaginary domains will be displayed. The FFT is a display of the magnitudes of the fourier frequencies in the data. Therefore, if you zero the lowest FFT data points, you will filter out low frequency information such as a slowly rolling baseline. If you zero the highest FFT data points, you will filter out high frequency noise in your spectrum. A dialogue box prompts the user for the starting and stopping filter points. The suggested High Filter value is the point at which the FFT signal has decreased to 0.025 (1/40) of its highest value. The FFT spectra are displayed with this value as the middle point of the X domain. For instance, if the 0.025 point occurs at FFT datapoint 98, then the X domain of the display will be from 0 to 196. This value is only a guess at a good point for filtering, the user may want to change it based on the display. If it appears that significant signals exist beyond that point, the user should enter a higher value. FFT datapoints above (to the right) of the High_Filter will be zeroed, and FFT datapoints below (to the left) of the Low_filter will be zeroed. Once you have verified the filter points, click on the High_Filter and/or Low_Filter buttons to actually zero out those FFT datapoints. Then select Keep compute the inverse FFT and receive the filtered spectrum; or select Discard to return to the un-filtered spectrum. Once a spectrum has been filtered, it must be re-opened from disk to go back to the original data.
The following display shows a spectrum before and after filtering:
Speeding simulations by combining FFT Real & Imaginary
Simulation speed is improved by calculating only the FFT signal and thus not computing the inverse FFT. To compare with the experimental, we must first create the FFT of the experimental spectrum. Because the FFT has both Real and Imaginary domains, we then have two signals to display. However, only the first half of the FFT datapoints are meaningful, the Nicest theorem. Therefore, we can display the FFT signal as a combination of the Real and Imagines by just tacking on the Real component onto the end of the Imaginary. As with the filtering, we can discard frequencies that have insignificant intensity. When a user chooses Manipulations:Combine_FFT, the FFT of the experimental spectrum is computed and the Real and Imaginary domains are displayed. As with the filter function, the 0.025 (1/40th) intensity is chosen as a like combination point; although, the user may input another value. Once the user accepts a value, the experimental spectrum will be represented by the significant portion of the Imaginary domain on the left and the same size portion of the Real domain on the right:
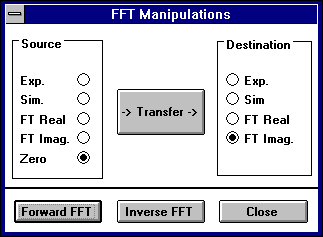
Accessing FFT data directly
The forward and inverse FFT of the experimental can be computed using Manipulations:exp_>>_FFT and Manipulations:exp_<<_FFT respectively. The display will switch appropriately.
If you use external programs to process FFT data you can save and load those datasets independently using the Manipulations:Controls selection which brings up a dialogue box with controls for transferring datasets and executing forward and inverse FFT computations directly.
Introduction to EPR simulations
Simulating spectra
The most definitive means of identifying a free radical species is to compute a successful simulation and assign the hyperfine parameters to structural members. The most important function of this program is to assist the user in that process. This program is specialized to compute the simulations of multiple species of freely rotating isotropic free radicals, such as found in complex biochemical spin trap systems. PEST WinSIM has the following capabilities:
- Computes up to 10 species of free radicals.
- Computes up to 16 hyperfine nuclei sites per species. Each site may have an unlimited number of equivalent nuclei.
- First order FFT based computations.
- Approximates the M(I) dependent linewidths of motionally restricted nitroxide radicals, assigning independent linewidths to the -1,0,+1 line positions.
- Approximates the effects of Time Constant and Modulation Amplitude.
- Adjustable mix of Lorenztian and Gaussian lineshapes.
- Optimizes any/all simulation parameters via:
- LMB1 algorithm (published in J.M.R.)
- Simplex algorithm
- Any parameter may be excluded from optimization.
- Variable limits on parameter adjustment during optimization.
- Graphically interactive and batch mode Optimization.
- Optimization reports generated.
Setting instrument and global spectral parameters
Choose Simulation:Scan_info to enter consequential instrumental parameters :
- Field Center (G)
- Scan Range (G)
- Modulation amplitude (G)
- Time Constant (TC)
- Harmonic ( 0th, 1st, 2nd )
- CW or FFT
- Simple isotropic or M(I) dependent nitroxide
To skip the Mod.Amp. and Time Constant computations, enter zero for their values. Note that that the Time Constant is expressed as the ratio which is generally in the range of 0.1 to 1.0 for most CW scans :
TC = Time Constant (ms) / Scan Time (s)
Setting hyper fine coupling, relative area, and line shape values
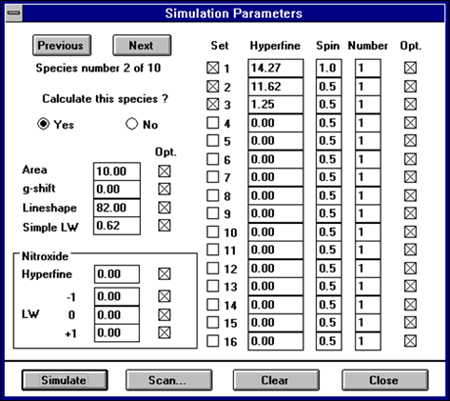
Choose Simulation:Parameters to edit the hyperfine, relative area, and lineshape parameters. A LARGE dialogue box appears with several input fields:
- Previous] [Next] : use these buttons to skip to another radical species.
- Calculate this species : choose whether or not to include each species in the simulation. Note that if no species are computed, a single line should result.
- Area : the relative spectral area of each species. For single species this data is not used. All simulations are computed with the same maximum peak height as the experimental spectrum if one is present.
- g-shift : the relative shift in gauss of the center of the spectrum (in G) from field center. This is used to move the spectrum in the magnetic field domain. I used this method since this value is more straightforward to estimate than g-value.
- Lineshape : the percentage of the spectrum that has Lorentzian shape. A pure lorentzian line would be 100%. A pure Gaussian line would be 0%.
- Simple LW : the linewidth used when computing single linewidth spectra. If nitroxide simulation is chosen, then this value is not used.
- Nitroxide : If nitroxide simulation is chosen, then these values are used in the computation:
Hyperfine: coupling from the principal nitrogen nuclei. LW -1: the low field component linewidth LW 0 : the middle field component linewidth LW +1 : the high field component linewidth
Each of these fields has a checkbox [x] in the Opt column for selecting if that parameter is to be adjusted during optimization. To exclude a parameter from optimization ( ie.. fix the value as constant ), make this selection unchecked.
Then enter the hyperfine coupling parameters as in this example :
| Set | Hyperfine | Spin | Number | Opt |
|---|---|---|---|---|
| [x] 1 | 14.0 | 1.0 | 1 | [x] |
| [x] 2 | 16.2 | 0.5 | 1 | [x] |
| [x] 3 | 2.2 | 0.5 | 3 | [ ] |
| [ ] 4 | 2.2 | 1.0 | 2 | [ ] |
The simulation will be computed with a spin=1 and coupling=14.0G nucleus ; a spin=1/2 and coupling=16.2 G nucleus ; and a spin=1/2 and coupling=2.2 G on three nuclei ( producing the 1-3-3-1 pattern of a methyl group ). Set #4, with a spin=1.0 and coupling=2.2 on two nuclei is not computed since the leading checkbox is not selected. The Opt field is used to indicate if that parameter should be adjusted during the optimization, in this example only the first two hyperfine will be adjusted during optimization. The user could easily switch off Set #3 and switch on Set #4 to alternate hypothesis about the radical structure.
Now select [Simulate] (or press Enter) to compute the simulation. The simulated spectrum will be plotted on the screen along with the experimental. (if there is an experimental spectrum loaded) The Simulation Parameters dialogue box will stay on the screen, the user can close the box or just move it to the side of the screen. This allows quick cycling of changing parameters - computing spectrum - viewing results.
Computing the correlation value and residual spectrum
Choose Simulation:Correlation to compute the Spearman's Rank Correlation Coefficient between the current experimental and simulated spectra. The value shows up on the status bar at the bottom of the PEST WinSIM window. Choose Simulation:Residual to subtract the simulated spectrum from the experimental spectrum. Choose it again to quickly return to the simulated spectrum.
Introduction to Optimizations
PEST WinSIM will adjust the values of the simulation parameters to create the best fit between simulated and experimental spectra. This is an iterative process consisting of guess adjustments, trial computations, and error computation. In general, EPR spectra are overdetermined, that is, more than one set of simulation parameters will produce an apparently good fit to the experimental spectrum. Therefore, any optimization algorithm must rigorously check the error space for local minima in the error estimation to produce a robust result. Two algorithms have been implemented: LMB1 was developed by Dave Duling as an extension and derivation of the TUNE algorithm of Ann Motten and Joerg Schreiber and was published in J.M.R. The well known Simplex algorithm is also available. References for both methods may be found in the PEST manual reference section.
Select Simulations:Optimize to initiate the process. Choose the algorithm you will use and [Setup] to change the default optimization. Choose Constraints to set boundaries on how far certain parameters my deviate from their initial values.
Setting Optimizing Options
Optimization options
-
LMB1 setup
Hyperfine analysis: Two options are available: - Non-parametric : hyperfine values are adjusted independently
- Parametric : hyperfine values are adjusted such that the sum of splitting values multiplied by twice the spin multiplied by the number of nuclei is constant. The keeps the total spectral width constant. Use this when you are certain of the end lines.
Parameter descent gradient: Initially, the simulation parameters are adjusted in large increments and then increment size is decreased to digital resolution in finite steps. This value controls the curvature of the descent. The default value is binary which is the steepest descent. Quadratic and linear descents are much less steep and thus consume much more time but are somewhat less likely to miss important minima in the error domain. Levels of granularity: This controls the number of steps in the parameter descent curve. The steeper the descent, the smaller this value should be. For instance, the default value for binary gradient is 7, while corresponding value for linear would be 2^7=128. -
Simplex setup
Number of restarts: controls the number of times the algorithm will restart once it has reached an error minimum. Max. iterations per restart: this puts a limit on the number of trial simulations that will be computed, keeping the program from wandering endlessly when it has an obviously wrong set of parameters. Fractional tolerance: Simplex stops when the slope of the imaginary line connecting the lowest errors thus far achieved is below a certain value. This tells the algorithm when to terminate within a minima. -
Constraints
Used to limit the range of parameter deviation. To simplify the selection process, WinSIM implements constraints for the major classes of parameters: Hyperfines, g-positions, Linewidths, and relative Intensity. Enter a percentage value for the amount of deviation from the original value and use the checkbox [x] to enable or disable these constraints. Constraints are only enabled for the LMB1 algorithm.
-
Data point range
Use this to limit the range of the scan that is used in the error computation, for instance when an unidentified signal grows during the scan to dominate the high field area ; when the main signal just decays very rapidly ; or when a bad baseline effect is visible in the wings.
Starting an Interactive or Batch Optimization
WinSIM may start either a interactive or batch mode optimization. Interactive Optimization run in the WinSIM window and present continuous updates of the simulation plot and error statistics. Batch mode Optimization run as a separate TUNE process whose results can only be viewed after the process has completed. However, several TUNE processes can be run concurrently and these processes may be run on other computers on the network.
Select [ GO ] to start the optimization as an interactive process. The plot of the simulation and experimental spectra will update on a timely basis and the status bar will show the current status of the optimization with the following information:
- Algorithm used: LMB1 or Simplex
- Starting error ( sum of squared residuals )
- Current error
- Number of simulations ( n )
- and - - Level : LMB1 parameter for the current step, see levels of granularity above; this value will decrement to one. If this value seems to never change, it may indicate that the initial parameters are in error, which would be obvious by the simulation plot.
- Species, Par : LMB1 parameters for the current species and parameter being optimized. This is mostly for internal use as a programmer's diagnostic.
- or - - Restart : SIMPLEX restart value, this value will increment to the number of simplex restarts, see above.
Select [ TUNE ] to start a batch mode optimization. This will run the Tune program as a separate process; therefore, you may run several TUNE program Optimization concurrently to test different hypothesis or to test one hypothesis on several sets of data. WinSIM will present a dialogue box with these options:
| Format: | choose NIEHS binary or ASCII format data files. If the TUNE will be run on your Windows PC computer, choose binary. If you intend to run TUNE on a UNIX computer, choose ASCII. |
|---|---|
| Filename: | TUNE requires input files to execute; WinSIM will write out the required TUNE files automatically. By default, the current filename with an underscore prepended will be used. The user may enter a different filename if needed. The files will be written into the current directory. |
| [ Start Now ]: | Choose this to initiate the TUNE process. First the necessary files will be written, then TUNE will be started as a separate process. The directory containing the TUNE binary (tune.exe) must be in the current system PATH (this is usually c:\lab). |
| [ Save files ]: | Choose this to only save the necessary TUNE files but not start the TUNE process, for instance, when the TUNE is going to be run on a UNIX computer. |
| [ Read results ]: | Choose this to read in the TUNE results once a TUNE has completed. The files associated with the above displayed filename will be read. The simulation spectrum is not read automatically, but can be easily calculated with a Simulation:Simulate selection. |
Reading Optimization Results
The optimization results are written in three places, depending on whether the process is run interactively or in batch mode.
| Printout file: | A printout file is created containing the final parameters and error statistics in a readable and printable ASCII form. For interactive Optimization, the Notepad program is launched with this information. For batch Optimization, a file is written with a .epr extension, if you read in the TUNE results through the TUNE dialogue box, this file will be loaded into a new instance of Notepad. |
|---|---|
| Parameter file: | A parameter file is created containing the final parameters in the TUNE input format which can be read by TUNE or WinSIM. This file has the .par extension. Only the batch mode TUNE program produces this file at the end of an optimization; however, WinSIM can produce this file through the File:Save:Project options. |
| Simulated spectrum: | A simulated spectrum file is created by the batch mode TUNE program; however, WinSIM can produce this file through the File:Save:Project options. This file has the .sim extension if it is a NIEHS binary file or the .dat extension if it is an ASCII file. |
Accessing Online Help Functions
Select Help:
| Index | To view this help file. The Edit:Preferences must be correctly entered and saved. |
|---|---|
| Database | To access the online Spin Trap Data Base (STDB). The Edit:Preferences must be correctly entered and saved. |
| About | To view information about the author of this program and the revision being used. |