- Double click on PAGE.bat.
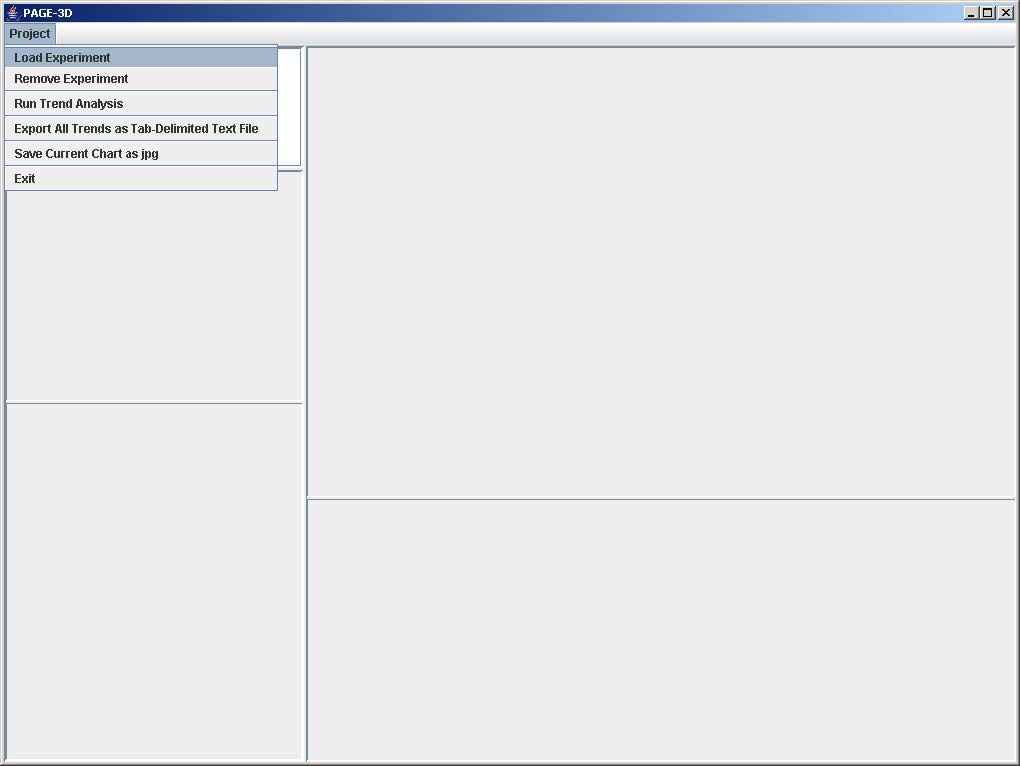
Click on Project and select Load Experiment.
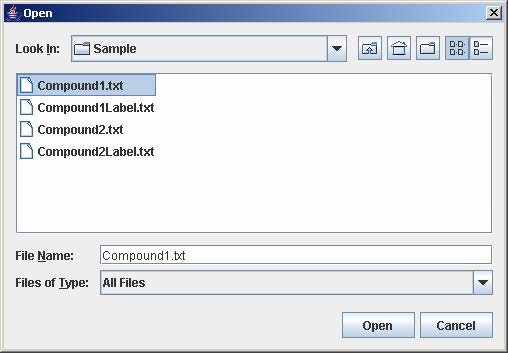
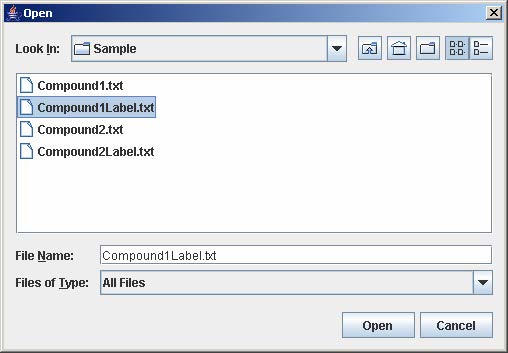
Select Compound1.txt and click Open.
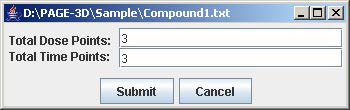
Enter 3 for total dose points and total time points. Then, click Submit.
Click on Load.
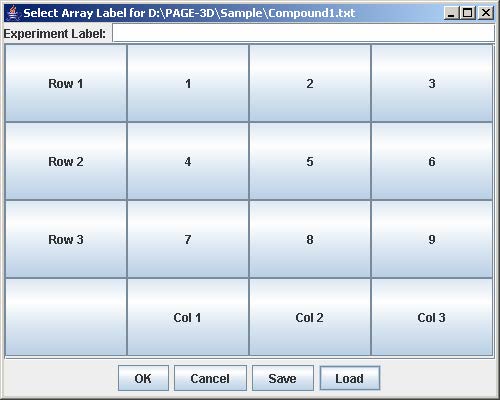
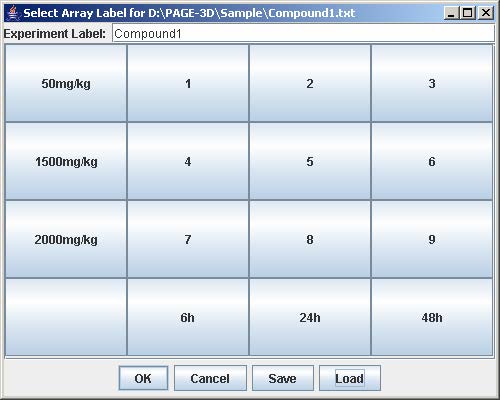
Select Compound1Label.txt and click Open.
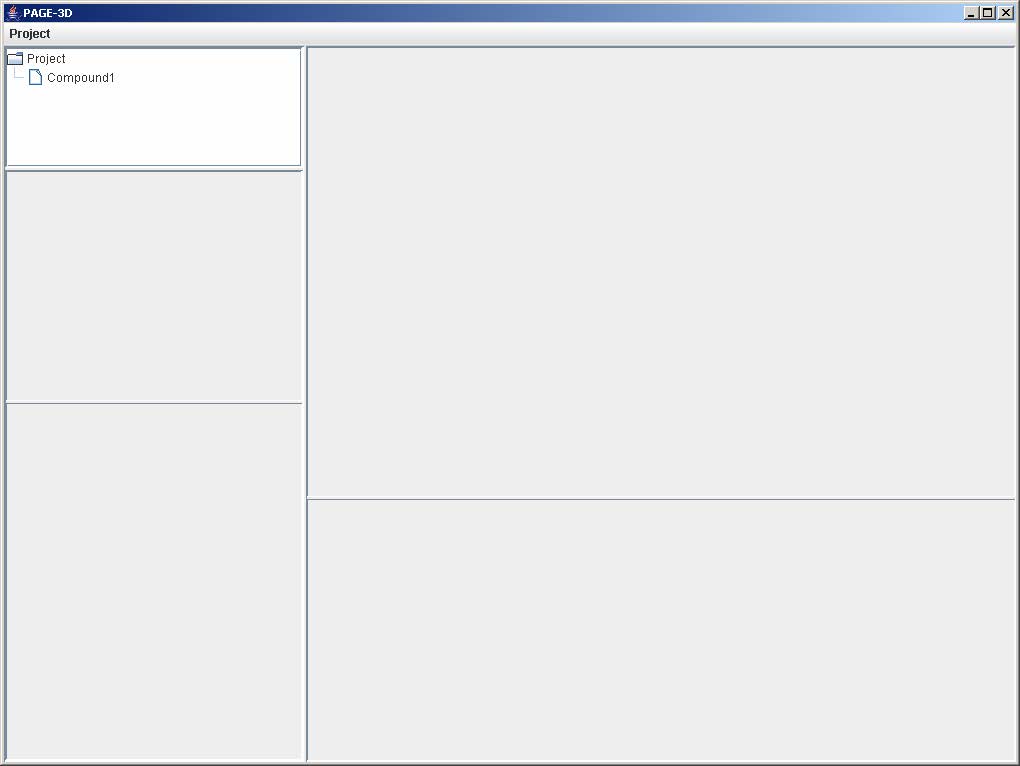
Click OK.
Click on Project and select Load Experiment again.
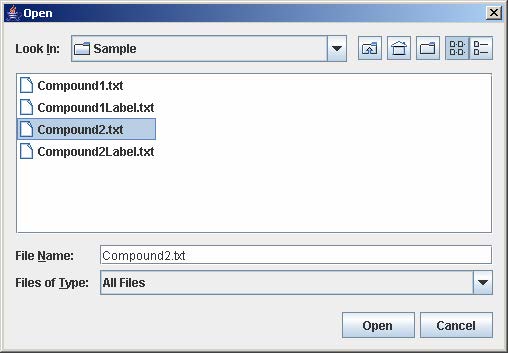
Select Compound2.txt and click open.
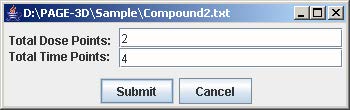
Enter 2 for total dose points and 4 for total time points. Then, click Submit.
Click on Load.
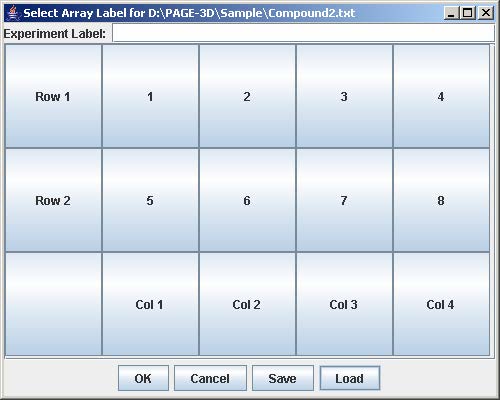
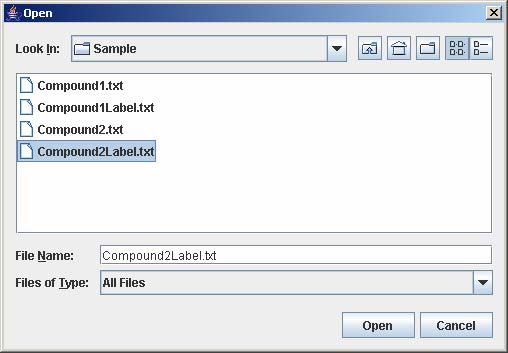
Select Compound2Label.txt and click Open.
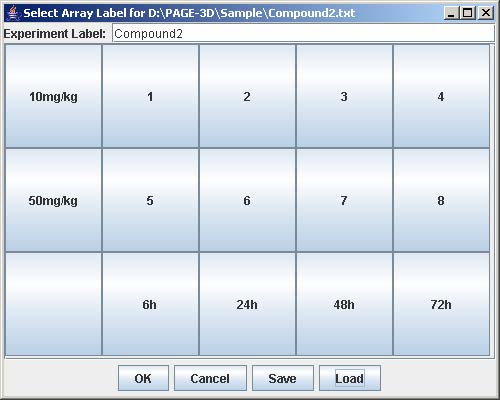
Click OK.
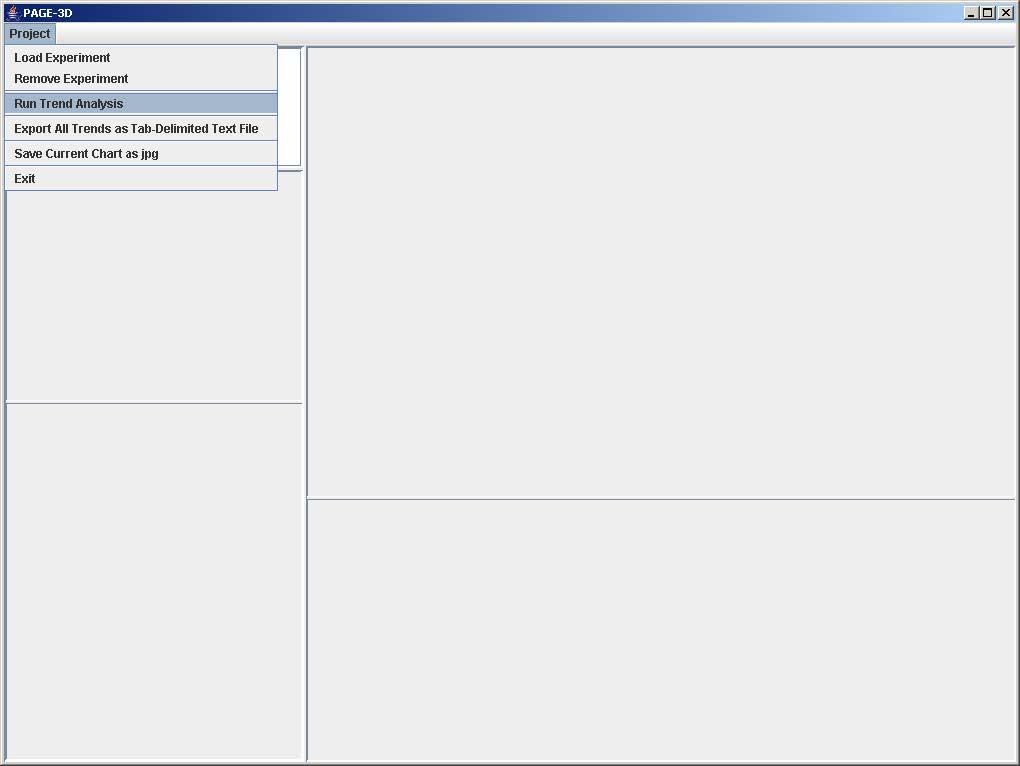
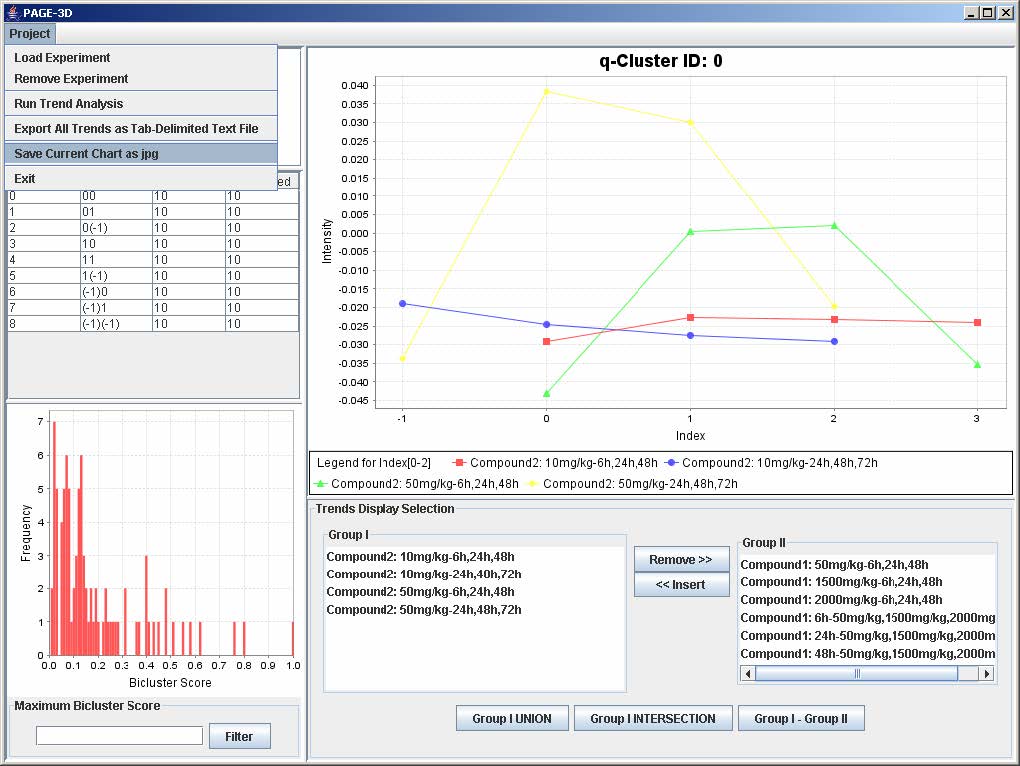
Click on Project and select Run Trend Analysis.
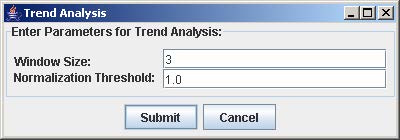
Enter 3 for window size. Then, click Submit.
Select all the trends form Compound1 in the Trend Display Selection Panel.
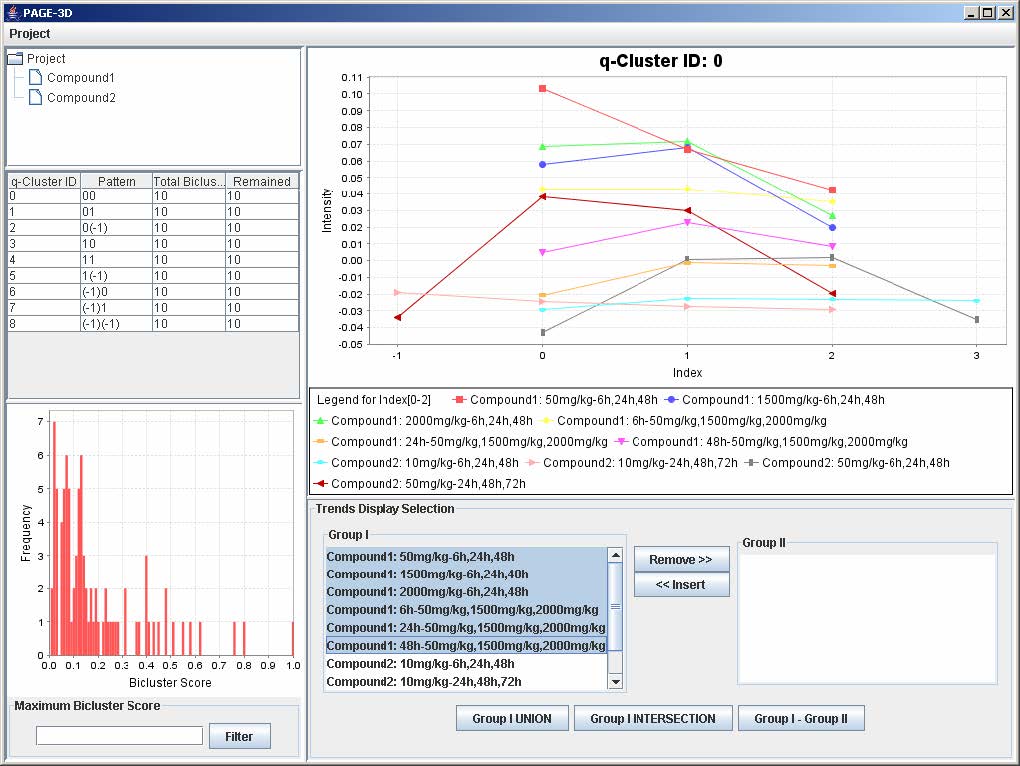
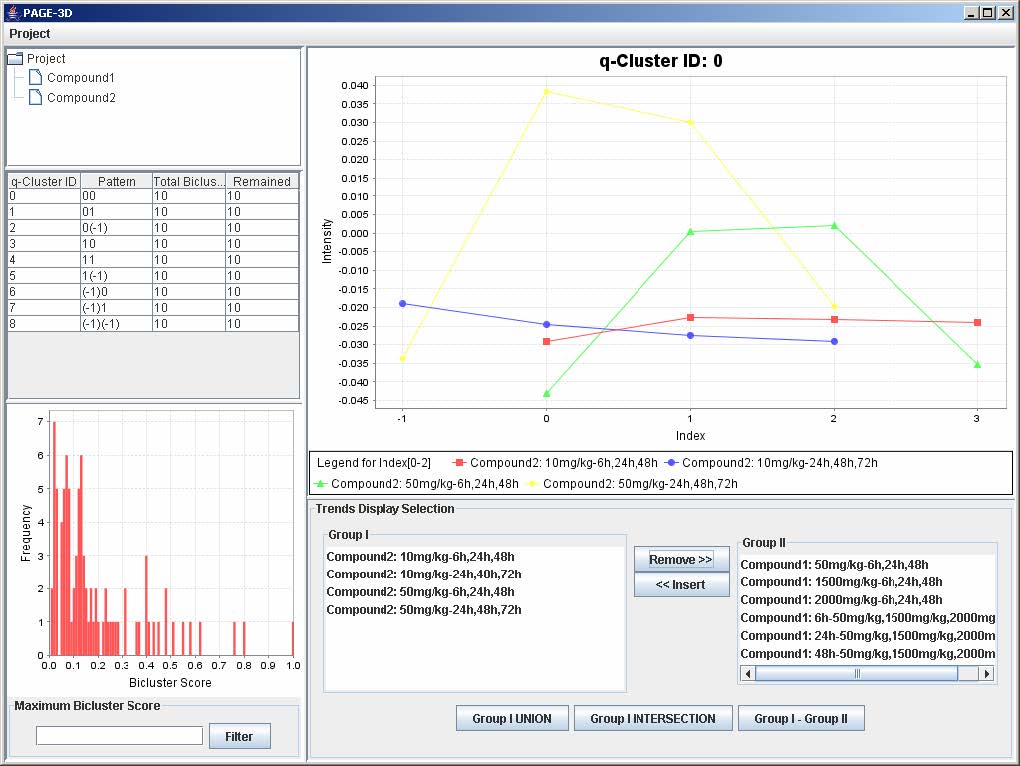
Click the "Remove>>" button.

Click on the “Group I Union” button.
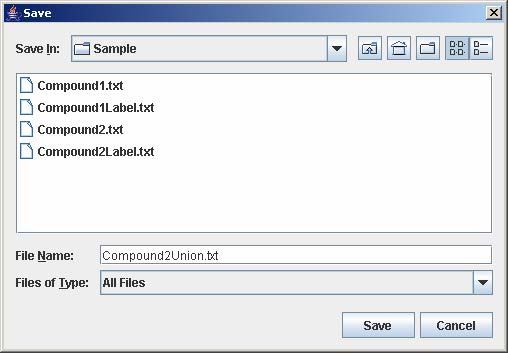
Click on File and select Save As Tab-Delimited.
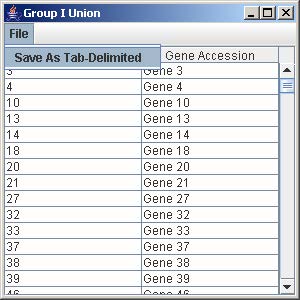
Enter Compound2Union.txt and click Save.
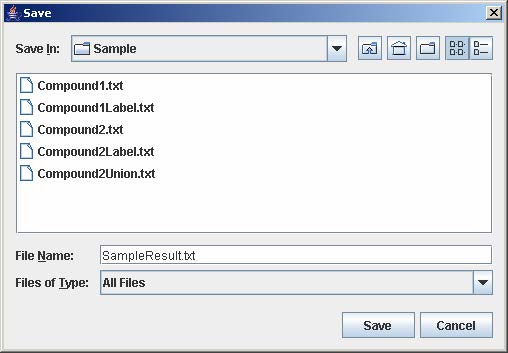
Click on Project and select Export All Trends as Tab-Delimited Text File.

Enter SampleResult.txt and click Save.
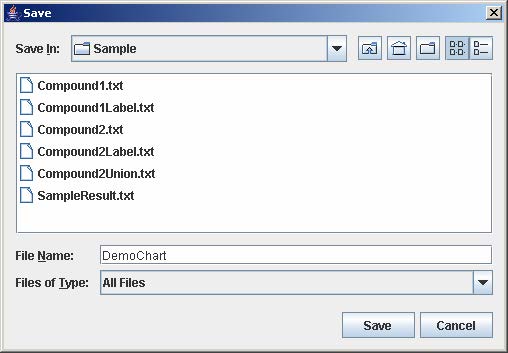
Click on Project and select Save Current Chart as .jpg.
Enter DemoChart and click Save.
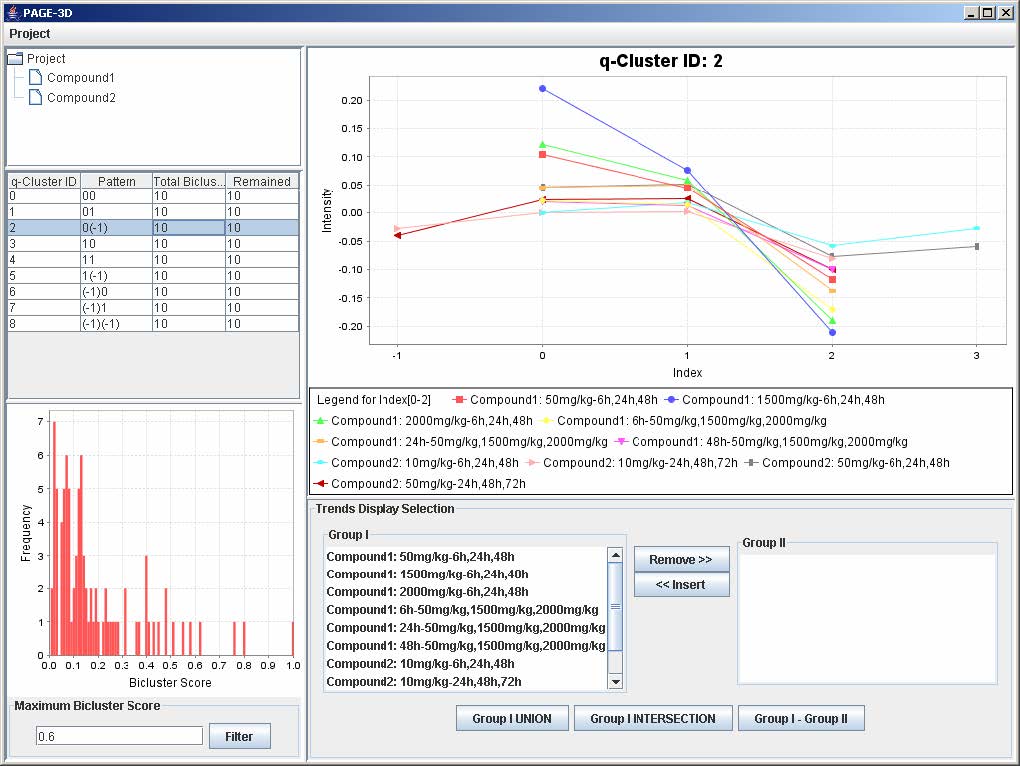
Enter 0.6 for Maximum Bicluster Score in the lower left panel and click Filter.

Click on q-ClusterID 2 in the Table listing the q-Cluster Ids.
Click on Project and select Exit.


An official website of the United States government

The .gov means it’s official.
Federal government websites often end in .gov or .mil. Before sharing sensitive information, make sure you’re on a federal government site.
The site is secure.
The https:// ensures that you are connecting to the official website and that any information you provide is encrypted and transmitted securely.
National Institute of Environmental Health Sciences
Use this QR code to view the newest version of this document
Quick Start Guide for PAGE Software
to Top
Last Reviewed: May 08, 2026