

Input
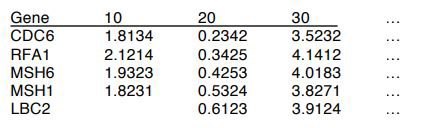
The format of the data input is a table in the following format: There should be a singular header row made up of one gene name column and T columns representing gene expression values at T time-points. There should also be G rows, representing all of the genes to be considered. If no data was collected for a gene at a specific time point, that corresponding cell should be left blank, but still tabbed. The program will ignore that time-point for that particular gene.
Example:
Running the Function
This function requires the ucminf package which is publicly available on the CRAN database. The ucminf package in turn requires the numDeriv package, which is also publicly available on the CRAN database. Both can be downloaded from the R GUI and both must be loaded on the specific R console before this function can be run.
The function is named ccoptim and takes only three arguments, the first being the location of input .txt file (ex. "C:\\Users\\User\\Documents\\Input.txt"), the second being the output directory (ex. "C:\\Users\\Documents\\"), and the third being a boolean asking the user whether or not plots should be made for each estimate. If no output directory is specified, the function defaults to the working directory of the user, and if no boolean is specified, the function defaults to FALSE, meaning no graphs will be produced.
Example:
ccoptim("C:\\Users\\User\\Documents\\Input.txt","C:\\Users\\Documents\\",TRUE)
ccoptim("C:\\Users\\User\\Documents\\Input.txt")
The second defaults both output to the working directory and plot to FALSE
Output
The program outputs five data tables (and a plot for each gene in question if plot is set to TRUE).
The first, output.txt, which contains the parameter estimates, is formatted as follows:
Each row is 8 values long, and below is each cell's respective meaning
[i,0] the gene name
The six parameters
[i,1] y-intercept
[i,2] slope
[i,3] amplitude
[i,4] phase-angle
[i,5] period
[i,6] attenuation
[i,7] Value of least absolute error function evaluated at point
The second and fourth, covarm.txt and infom.txt, contain the covariance and information matrix respectively, and their format is as follows:
[i,0] the gene name
Covariance/Information matrix values
[i,1] [1,1]
[i,2] [2,2]
[i,3] [3,3]
[i,4] [4,4]
[i,5] [5,5]
[i,6] [6,6]
[i,7] [1,2]
[i,8] [1,3]
[i,9] [1,4]
[i,10] [1,5]
[i,11] [1,6]
[i,12] [2,3]
[i,13] [2,4]
[i,14] [2,5]
[i,15] [2,6]
[i,16] [3,4]
[i,17] [3,5]
[i,18] [3,6]
[i,19] [4,5]
[i,20] [4,6]
[i,21] [5,6]
[i,22] the condition number of the matrix
The third and fifth, covarmwoslp.txt and infomwoslp.txt, contain the covariance and information matrix respectively without the slope parameter taken into account, and their format is as follows:
[i,0] the gene name
Covariance/Information matrix values
[i,1] [1,1]
[i,2] [2,2]
[i,3] [3,3]
[i,4] [4,4]
[i,5] [5,5]
[i,6] [1,2]
[i,7] [1,3]
[i,8] [1,4]
[i,9] [1,5]
[i,10] [2,3]
[i,11] [2,4]
[i,12] [2,5]
[i,13] [3,4]
[i,14] [3,5]
[i,15] [4,5]
If graph is set to TRUE, jpeg files will be formed in the format RplotXXXXX.jpg. The title of each plot will be the name of each gene, and that plot will reflect the XXXXX gene evaluated as indicated in the file name.