Introduction
EpiCenter is a versatile tool for analyzing both mRNA-seq and ChIP-seq data, especially for two-sample comparison analysis. EpiCenter was mainly designed for 1) histone ChIP-seq data analysis to identify genomic regions enriched with epigenetic markers and/or changed in enrichment levels, 2) mRNA-seq data analysis to detect differentially expressed genes. EpiCenter can also do peak-finding analysis of transcription factor binding sites when an input DNA control sample is available. In addition, it can convert mRNA-seq or ChIP-seq data into the microarray-like log2-ratio data in a matrix form, enabling direct use of existing microarray analysis methods. To use EpiCenter, sequence reads from mRNA-seq or ChIP-seq must first be first mapped to their reference sequences. The current version of EpiCenter supports SAM, BAM, ELAND export, MAQ, and UCSC BED file formats. Note that EpiCenter supports two MAQ formats (not interchangeable): EpiCenter_maq_short for reads up to 64bp, and EpiCenter for reads up to 128bp (see input format below for details). EFor our detailed methods, please see our publication.
Citation
W Huang, DM Umbach, N Vincent Jordan, AN Abell, GL Johnson, and L Li. Efficiently identifying genome-wide changes with next-generation sequencing data. Nucl. Acids Res. (2011). [Abstract W Huang, DM Umbach, N Vincent Jordan, AN Abell, GL Johnson, and L Li. Efficiently identifying genome-wide changes with next-generation sequencing data. Nucl. Acids Res. (2011).]
Availability
EpiCenter is freely available to the public. The binary packages of EpiCenter are available for all three major operating systems: Linux, Macintosh, and Windows, and can be downloaded at the following links. The C++ source code is also available upon request for advanced users.
NOTE: please install and use a 64-bit version program if you have 64-bit operating system. 32 bit packages are for the 32-bit operating system and you may be not able to use it to analyze very large datasets if more than 4GB memory is required for the analysis.
Recommended Hardware Requirements
- CPU: 1GHZ or higher
- Memory: 4GB or more
- Disk space: 100GB or more
Installation is to simply decompress one of the above EpiCenter compressed packages to your installation location.
Linux or MacOS X
If you download the package epicenter_<OS>.tar.gz to the folder "/home/<username>/downloads", and then you can issue the following commands to install the program to the folder "/home/<username>/install_dir" at your terminal window:
- cd /home/<username>/install_dir
- tar xfz /home/<username>/downloads/epicenter_<OS>.tar.gz
- cd epicenterDIR
- if needed, run ./install.sh to copy main executable binary files into "/home/<username>/bin"
Windows
EpiCenter's packages are in ZIP packages. Installation is simply to extract the package to a desired installation location. After extraction, open the extracted folder "epicenterDIR". Then double click the window batch file "launch_epicenter.bat" to launch Windows' Command Line Terminal, where you can run EpiCenter programs.
All programs and documents will be in the folder install_dir/epicenterDIR.
Download
Version 1-7-0-8 (Latest Version)
- 64-bit system
- Linux packages: epicenter_Linux64.tar.gz (4MB)
- MacOS X packages: epicenter_MacOS64.tar.gz (3MB)
- Windows packages: epicenter_Win64.zip (6MB)
- 32-bit system
- Linux packages: epicenter_Linux32.tar.gz (4MB)
- MacOS X packages: epicenter_MacOS32.tar.gz (3MB)
- Windows packages: epicenter_MacOS64.tar.gz (3MB)
Version 1-6-1-8
- 64-bit system
- Linux packages: epicenter_Linux64.tar.gz (4MB)
- MacOS X packages: epicenter_MacOS64.tar.gz (3MB)
- Windows packages: epicenter_Win64.zip (6MB)
- 32-bit system
- Linux packages: epicenter_Linux32.tar.gz (4MB)
- MacOS X packages: epicenter_MacOS32.tar.gz (3MB)
- Windows packages: epicenter_Win32.zip (3MB)
Version 1-5-9-8
- 64-bit system
- Linux packages: epicenter_Linux64.tar.gz (2MB)
- MacOS X packages: epicenter_MacOS64.tar.gz (1MB)
- Windows packages: epicenter_Win64.zip (4MB)
- 32-bit system
- Linux packages: epicenter_Linux32.tar.gz (2MB)
- MacOS X packages: epicenter_MacOS32.tar.gz (1MB)
- Windows packages: epicenter_Win32.zip (1MB)
Version 1-5-8-8
- 64-bit system
- Linux packages: epicenter_Linux64.tar.gz (2MB)
- MacOS X packages: epicenter_MacOS64.tar.gz (1MB)
- Windows packages: epicenter_Win64.zip (4MB)
- 32-bit system
- Linux packages: epicenter_Linux32.tar.gz (2MB)
- MacOS X packages: epicenter_MacOS32.tar.gz (1MB)
- Windows packages: epicenter_Win32.zip (1MB)
Version 1-5-7-8
- 64-bit system
- Linux packages: epicenter_Linux64.tar.gz (2MB)
- MacOS X packages: epicenter_MacOS64.tar.gz (1MB)
- Windows packages: epicenter_Win64.zip (4MB)
- 32-bit system
- Linux packages: epicenter_Linux32.tar.gz (2MB)
- MacOS X packages: epicenter_MacOS32.tar.gz (1MB)
- Windows packages: epicenter_Win32.zip (1MB)
Usages
- Usage (type 0-3, 31, 32) for Genome-wide comparison analysis of two samples
EpiCenter -t analysis_type [options] –i aln_type aln_sample1 aln_sample2
- Usage (type 4) for read coverage analysis of a single sample
EpiCenter -t 4 [options] –i aln_type aln_sample
- Usage (type 5) for converting ChIP/mRNA-seq data files into a microarray data matrix
EpiCenter -t 5 -f gonomic_LOC_info_file [options] –i aln_type aln_file1 [aln_file2 ...]
Examples
- While genome identification of differentially changed regions with a semi-dynamic window consisting of multiple 100bp-fixed length windows, estimating the expected read rate ratio of “unchanged” regions by the ratio of total mapped reads between samples, and printing out analysis log information to the result files, and outputting read coverage WIG files
EpiCenter -t 0 –c 0 –w 100 -H -W –i bam aln_sample1.bam aln_sample2.bam
- ChIP-seq data analysis of 1000 bp upstream and 500 downstream promoter regions
EpiCenter -t 3 -H –R –U -f tss_genome_loc.txt –u 1000 –d 500 –i bam aln_sample1.bam aln_sample2.bam
- ChIP-seq data analysis of gene regions
EpiCenter -t 31 -H –R –U -f gene_genomic_loc.txt –i maq aln_sample1.map aln_sample2.map
- mRNA-seq data analysis of gene regions
EpiCenter -t 31 -L –R –H -f gene_genomic_loc.txt –i maq aln_sample1.map aln_sample2.map
- mRNA-seq data analysis of read data mapped to cDNA sequences
EpiCenter -t 32 –R -L -H -f gene_info.txt –i maq aln_sample1.map aln_sample2.map
- Whole genome identification of differentially changed regions with a dynamic expanding window within which the maximum gap distance between reads is 50
EpiCenter -t 1 –B –w 50 –i maq aln_sample1.map aln_sample2.map
- Identification of TFBS binding sites with a dynamic expanding window within which the maximum gap distance between reads is 50
EpiCenter -t 1 -h l –w 50 –i sam ChIP_sample.sam input_control.sam
- Whole genome identification of differentially changed regions with a fixed-size window of 300bp.
EpiCenter -t 2 –w 300 –i maq aln_sample1.map aln_sample2.map
General Parameters
-t --type: the type of analysis requested. This is a required parameter, and its values must be one of the following eight numbers:
0 = whole genome semi-dynamic window scan for identifying all regions with significant difference in read abundance between two samples. For the analysis, epicenter starts with a region of a fixed size, which can be specified by the parameter –w, at the beginning of the genome reference, and performs the exact rate ratio test of the region. If the region is not significant, epicenter scans next fixed-size region; otherwise, the epicenter expands the region downstream to another fixed-size window, and again performs the exact test of the expanded region. If the expanded region is not more significant than the original region, epicenter will keep the original region for further tests, and scan a new fixed window immediate next to the original region; otherwise epicenter continues to expand the region in the same semi-dynamic way. With this type analysis, each significant region in the final report is of length of one or more fixed-size windows. If the option -W is given, this type analysis will generate genome-wide read coverage WIG data files, which can be visualized in the UCSC genome browser. The analysis is suited for exploring whole genome data, checking data quality, and read data normalization.
1 = whole genome dynamic window scan for identifying all regions with significant difference in read abundance between two samples. This analysis employs a full dynamical expansion window to locate more precisely regions with different read abundance. The size of a dynamic window depends mainly on read coverage itself, but also is affected by the cutoff of noise level and the maximum allowed gap distance between two reads. Both the noise level and the maximum gap distance can be specified by users. Because epicenter uses read mapping data only from the first data file to choose dynamic widows, the analysis is not symmetric with respect to two samples provided. However, if users give the ‘–T’ option, epicenter will do another dynamic-window scan using read mapping data from the second sample, and there will be two output report files as well. This analysis is especially useful for TFBS ChIP-seq data analysis, using ChIP-DNA data as the first sample, and input-DNA data as the second sample.
2 = whole genome fixed window scan is similar to semi-dynamic window scan, but each window is of the same length of a fixed-size window. The analysis is useful for initial data read coverage analysis, and for identifying unchanged regions for data normalization.
3 = analysis of fixed-length flanking regions of selected genomic point locations. This type analysis requires a list of genomic locations of interesting regions (genes), for each region, epicenter locates the starting location in 5’->3’ direction, and tests whether the fixed-size flanking region of the location is significant different between two samples. Each flanking region is of the same length that can be defined by users with two parameters ‘-u’ and ‘-d’ for upstream and downstream lengths, respectively. A good example of this type analysis is the analysis of 5’ promoter regions of genes, and it also can be used to analyze the flanking region of 3’ end of genes by exchanging ‘+’ and ‘-‘ of the DNA strand field in the input genomic location file.
31 = analysis of selected regions of variable lengths (e.g. genes). This type analysis is similar to the type 3 analysis, but, instead of using only flanking regions, entire genes or defined regions are included for analysis. Users also have the option to include flanking regions as well. This type analysis can be applied to analysis of mRNA-seq/ChIP-seq data of which reads are mapped to a genome reference.
32 = analysis of mRNA-seq data mapped to cDNA sequence references. This type analysis is almost the same as the type 31 analysis except that genes for this type analysis are individual cDNA references.
4 = read coverage analysis of a single sample using a fixed-size window scan. This analysis is to explore read coverage analysis of a single sample, and generate WIG coverage plot data file.
5 = conversion of multiple mRNA/ChIP-seq data files into one read count data matrix, where each row corresponds to a gene and each column corresponds to a sample/replicate.
-i --fformat: data format of input read alignment files
- eland = ELAND export format [default]
- maq = MAQ format generated by MAQ alignment tool
Note: there are two MAQ alignment formats: (1) alignment of long reads of length up to 128bp (the default format by MAQ version 7.0 or above), and (2) alignment of short reads of length up to 64 bp (the default format by old MAQ version below 7.0). Please use the standard version of EpiCenter for MAQ long-read alignment format, and use the EpiCenter_maq_short for short-read alignment format. - bam = BAM format
- sam = SAM format
- bed = UCSC BED file format with the following four fieds
chromosome, start_position, end_position, number_reads
-s --qual: the cutoff of alignment quality scores [default: 10].
- This is for filtering out low-quality alignment reads. By default, EpiCenter filters out reads with alignment quality score <10.
-o --outdir: directory for output files [default: current working directory]
- This is the file directory where EpiCenter will put all results files. By default, EpiCenter put all output files to the current working directory.
Parameters for Noise Read Rate (type 0-4)
-1 --nrate1 noise rate in #read tags per 1000bp genomic region for the first sample
-2 --nrate2 noise rate in #read tags per 1000bp genomic region for the second sample
- A noise rate is specified by the number of tags per 1000bp genomic region. If only nrate1 specified, then nrate2 is estimated by nrate2=nrate1*#mapped_tag_2/#mapped_tag_1, and vice versa.
- If “-U” or “--noLenNorm” option is also given, values given by these two parameters will be cutoff threshold of read counts in each gene or region, instead of noise rate per 1000bp.
-g --gsize: the length of genome reference [default: estimate from read mapping data]
- The genome size is used for estimation of the default noise rate. If genome size is not given, genome size is estimated from read mapping location. The estimation won’t be accurate if the reads are mapped to limited number of selected locations of genome.
Parameters for Type 0-3, 31, 32 Analysis
-q --fdr: cutoff of false discovery rate (FDR) [default: 5%]
- The cutoff false discovery rate as estimated by the Benjamini–Hochberg method. The FDR cutoff controls the output of significant genes reported by EpiCenter. If FDR sets to be 1, EpiCenter will output all genes with read counts above the given noise level.
-r --ratioexpect: expected rate ratio of read tags between two samples
- The parameter is used to specify the estimate of expected rate ratio of read tags between two samples. The estimate of expected rate ratio can be from EpiCenter’s genome-wide scan or from user’s own estimate. The accurate estimate is critical to determine significance of changes.
-e --std: the standard deviation of log2ratio null distribution
- This is to give the estimate of the standard deviation of log2ratio null distribution (a Gaussian distribution) for the z-test. For example, users can estimate the null distribution from biological replicates of the same type cells or conditions, then use the estimate to identify real significantly changed genes between different types of cells or experimental conditions.
-p --pcutoff: cutoff of p value of non-significant regions for estimating null distribution of log2ratio [default: 0.01]
- This is the cutoff p-value of the exact rate ratio test for identifying unchanged genomic regions to estimate read count variation between samples. Only genomic regions with p-value larger than the cutoff p-value are for estimating variation of the null distribution. The cutoff p-value will be adjusted for multiple testing by the Bonferroni method if the Bonferroni option is given.
-B --bonfer: requesting to adjust the pcutoff above with Bonferroni correction [default: No]
- If this option given, EpiCenter will adjust the cutoff p-value for identifying unchanged genomic regions in log2ratio null distribution. Bonferroni correction is typically recommended for most cases, especially with data of high-depth of read coverage.
D --depth: use peak depth of coverage for significant test
- If this option given, EpiCenter will used the peak depth, instead of total read count, within each region for significance tests. This is option for advanced users, and it is recommended only for data exploration or results comparison.
-U --noLenNorm: specify to not use the number of reads per 1000bp for the exact rate ratio test
- By default, EpiCenter uses the number of reads per 1000bp, the normalized read counts of a genomic region by length of the region, for the exact rate ratio test. If this option given, EpiCenter directly uses total number of reads in individual region for the exact test. The option also has the same effect on the noise rates given by the parameter nrate1 and nrate2.
-P --fwr: print out the decisions from three family wide type 1 error control methods
- EpiCenter can control type1 error rate by three family-wide error control methods: . However, by default, EpiCenter does not print out these family-wise type 1 error control results unless the option given. The results printed out are simply 0 or 1 for each method with 0 standing for acceptance and 1 for rejection.
-L --sortMaxP: sort by p_mx [default: by p_rr from the exact rate ratio test]
- The option specifys whether the output report is to be sorted by the maximum p-values from both the rate ration test and z-test. Although, the option is not enabled by the default, it is highly recommended for all type 3, 31, and 32 analyses.
-H --rep: print log information to the default report file [default: output to STDOUT]
- EpiCenter generates a summary data analysis log, such as read tag count for each sample, the estimate of expected rate ratio, and the null distribution of the z-test, for each analysis. Given the option, EpiCenter outputs these log information to the header of EpiCenter result report file. Otherwise, it outputs to the system’s standard output.
Parameters for Type 0-2, 4 Analysis
-w --wsize: the window size of a fixed-size or semi-dynamic window scan or the max gap distance allowed between neighboring tags in a dynamic window [default: 500bp]
- For a fixed-size or semi-dynamic window scan, this parameter defines the window size of non-overlapping region. Typically, a fixed-size window size should be >200bp. For a dynamic window scan, it is the maximum allowed gap distance between read tags within a dynamic window. The larger of the maximum gap distance allowed, the larger will be individual genomic regions. The maximum gap distance is typically less than 200bp.
Parameters for Generating UCSC WIG Files (type 0, 31)
-W --wigout: generate WIG files [default: no WIG output]
- This option indicates whether to generate read coverage data files in the WIG format. The WIG files can be visualized in the UCSC genome browser. If the option given, EpiCenter will output two WIG files, one for each input data sample.
-X --nozip: output plain text WIG files [default: gzipped WIG]
- The option is meaningful only when using together with the option “-W”. With this option, EpiCenter generates, instead of the default GZIP compressed WIG files, the plain text format WIG files.
Parameters for Generating a Data Matrix File for Read Coverage Plot (type 32)
-W --wigout: generate the depth of read coverage file [default: no]
- When this option is given for the type 32 analysis, EpiCenter generates, instead of WIG files, a single data matrix file of read coverage data in the following format:
- Id1, s1, d_p1_s1 d_p2_s1 ...
- Id1, s2, d_p1_s2 d_p2_s2 ...
- Id2, s1, ...
- Id2, s2, ...
- Where the first field of each line is gene id, and the second field is sample id (s1=first sample,s2=second sample), and remaining fields are read coverage depths of individual genomic positions from the beginning to the end of the gene. Users can use the data file to create read coverage plots of selected genes/regions by using the PERL and R scripts provided.
Parameters for Estimating the Expected Rate Ratio of Read Coverage (type 0)
-c --ratiochoice: choice of ratio estimate
- This parameter specifies which estimate of the expected rate ratio will be used for significance tests. Possible choices are: 0, 1, 2, and 3. 0 is to use the ratio of mapped tag counts as the estimate, while 1,2,3 are to use mean, median, least-squares regression slope of selected data of unchanged regions as the rate ratio estimate, respectively. If the choice is any one of 1, 2, and 3, EpiCenter will run tests to identify “unchanged” regions, and use them to compute the mean, median, and least-squares estimates. If the choice is 0, EpiCenter won’t compute these three estimates, so it will run a little bit faster.
-a --minQ: min quantile of data selected for ratio estimate [default: 0.85]
-b --maxQ: max quantile of data selected for ratio estimate [default: 0.95]
- These two parameters specify the range of sample-specific ranks of read count data from which EpiCenter identifies unchanged regions for estimating the expected rate ratio. If these two parameters are not given, EpiCenter selects, by default, the genome regions whose sample-specific read count rank are within [0.85, 0.95] in both samples.
Parameters for User-defined Genomic Location Scan (type 3, 31, 32, 5)
-f --locfile: the input file of genomic locations of all regions or genes
- The option specifies the input genomic location data file of regions/genes that users want to analyze. The input file is in the simple tab-delimited text file with the minimum number of fields 6. Currently, the first field is reserved but not used by EpiCenter. These fields are:
- any id
- chromosome
- DNA strand (+/-)
- start position of region
- stop position of region
- gene id or name
- length of cDNA sequence (required only for the type 32 analysis)
The example of gene location data file as shown below can be downloaded directly from the UCSC genome browser.
geneID chr str txtStart txEnd geneName length NM_028778 chr1 + 134212714 134230065 Nuak2 3095
-u --ulen: upstream region length [default: 500]
-d --dlen: downstream region length [default: 500]
- These two parameters are used to specify how long the flanking region of each gene/region in upstream or downstream should be included for analysis. The parameter is meaningless for the type 32 analysis, as each region for this type analysis is a whole individual cDNA sequence.
Parameters for Analysis of Selected Genomic Regions/Genes (type 3, 31, 32)
-R --autoR: indicating to use EpiCenter’s “parsimony” method to estimate rate ratio between samples.
- With this option, EpiCenter will use its “parsimony” method to estimate the expected rate ratio between samples. The “parsimony” method computes the expected rate ratio estimate by minimizing the number of significant genes/regions.
Parameters for Full Dynamic Window Scan (type 1)
-h –htest: specify whether to use two or one sided test [default: two-sided test].
- This option indicates whether one or two sided test should be used. Possible values are: “b”=two sided [default], “l”=less, and “g”=greater for one-sided tests. The default is “b”, two-sided test. For example, for genome-wide transcription factor binding site identification, one-sided test should be used if one sample is input-DNA control, and if input-DNA sample is the second data file, the option “l” should be used, otherwise “g” should be used.
-T --twoway: indicating to make another dynamic window scan using read data from the second data file as the reference of dynamic windows.
- Given the option, EpiCenter will make two-way dynamic window scans, each time using a different read data sample as reference. It’ll also generate two report files, one for each scan.
Parameters for Array Data Conversion (type 5)
-l --label: label for the top-left cell in output data matrix [default: epicenter]
- The option specifies the text label for the first cell in output data matrix.
-N --nonorm: no read count normalization [default: normalize read count]
- EpiCenter will output normalized read counts adjusted by total number of reads. Given the option, EpiCenter will output raw read counts to data matrix.
Outputs
Report Files and Data Formats
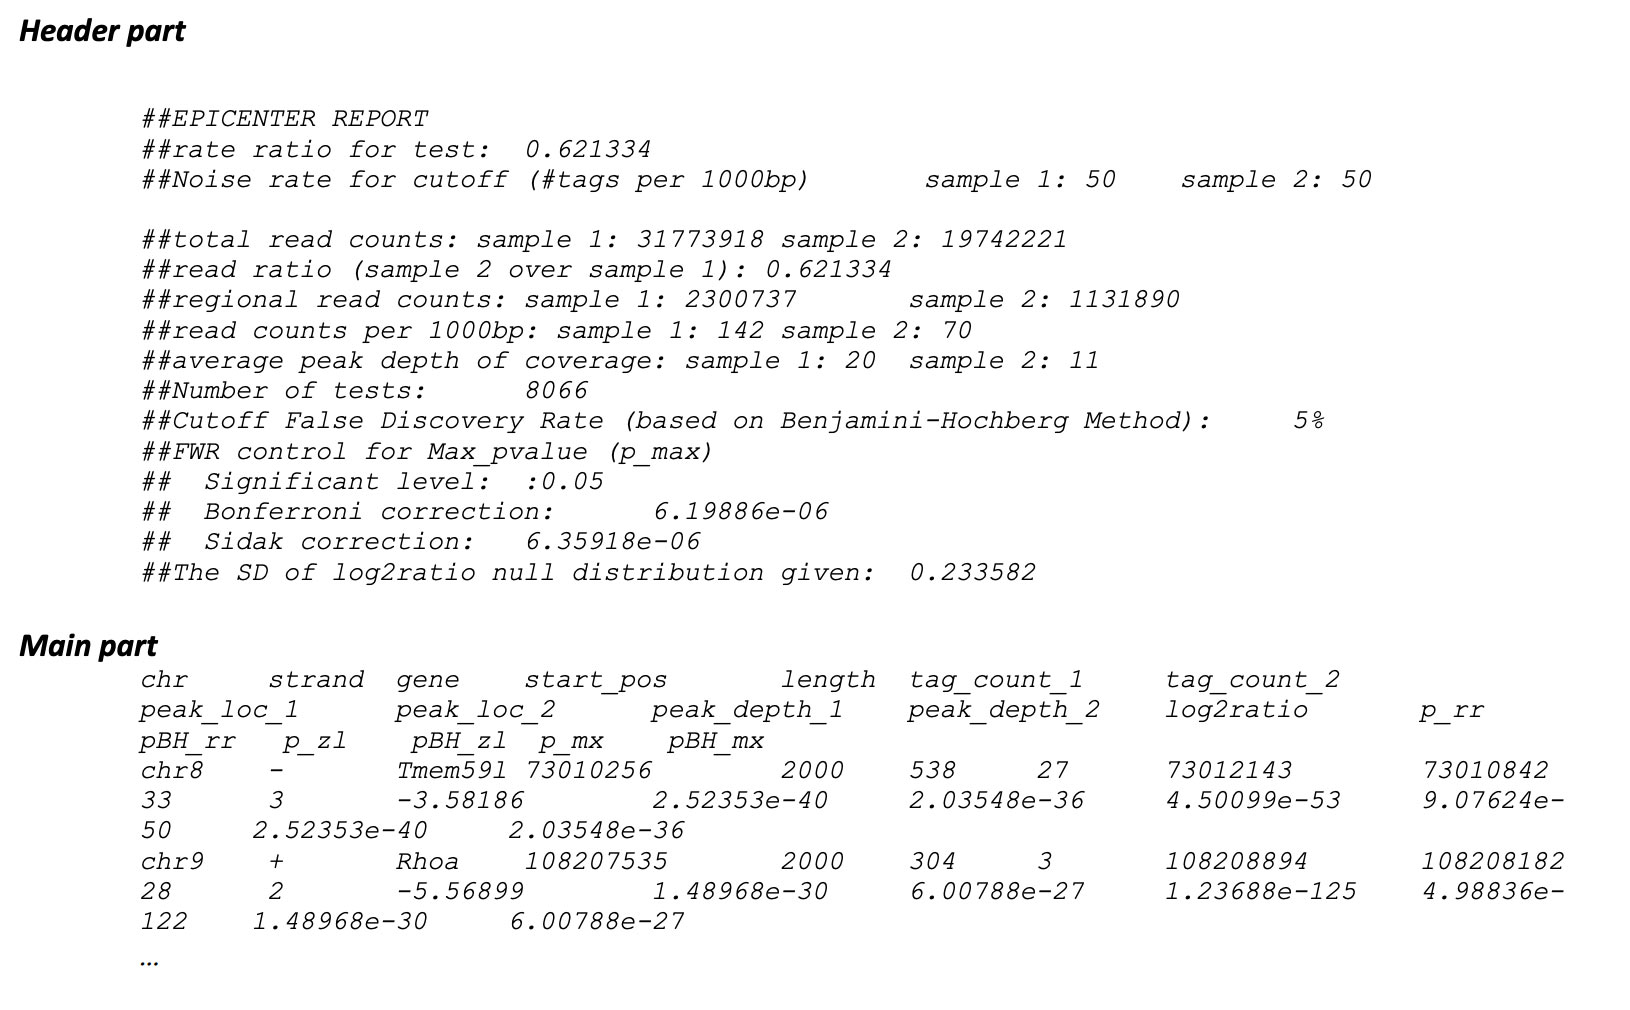
EpiCenter generates several output files that can be different for different types of analysis. The list of possible output files are: including a main report file with a filename extension “tscan” or “fscan” for analysis types 0-3, 31, 32, EpiCenter’s main report file typically consists of two parts: the header and the main content. The header at the beginning of the report file provides some overview of read data information, such as the number of read tags in each data file, read count in the regions analyzed from each sample, the estimated expected rate ratio, and significant cutoffs etc. The main content is the remaining part that includes genomic location, read counts, and testing p-values of individual genomic regions/genes. All possible fields in the main content are at the following:
- chr – chromosome name or number
These chromosome names or numbers are typically the names of individual reference sequences from read mapping data files. - strand – DNA strand
This is DNA strand on which the genomic region or gene is located. Possible values are: “+” for the forward DNA strand, and “-“ for the reverse complementary strand. - gene – gene name or access number
- start_pos – starting genomic position of the region
- length – length of the region
- tag_count_1 – number of read tags mapped to the region in the first sample
- tag_count_2 – number of read tags mapped to the region in the second sample
- peak_loc_1 – peak location within the region of read tags from the first sample
- peak_loc_2 – peak location within the region of read tags from the second sample
- peak_depth_1 – read coverage depth in the regional peak location of the first sample
- peak_depth_2 – read coverage depth in the regional peak location of the second sample
- log2ratio – log2 ratio of normalized read counts between two samples
- p_rr – p-value of the exact rate ratio test
- pBH_rr – Benjamini-Hochberg adjusted p-value of the exact rate ratio test
- p_zl – p-value of z-test
- pBH_zl – Benjamini-Hochberg adjusted p-value of z-test
- p_mx – the maximum p-value of p_rr and p_zl
- pBH_mx – Benjamini-Hochberg adjusted p_mx
- Bonferroni – significance indicator after Bonferroni correction of FamilyWise Error Rate
- Sidak – significance indicator after Šidák correction of FamilyWise Error Rate
- Holm – significance indicator after Holm-Bonferroni correction of FamilyWise Error Rate
An Example of EpiCenter Report File