

Systematic Variation Normalization (SVN) is to perform single and multi array normalization. Details can be found in the paper published in JBCB, Vol. 3, No. 2 (2005) 225-241 by Jeff Chou, Richard Paules, and Pierre Bushel.
Load files
- One channel compiled intensity or log intensity data in one file.
- Two channel compiled intensity or log intensity data in one file.
- Each two channel intensity data in one file, multiple files.
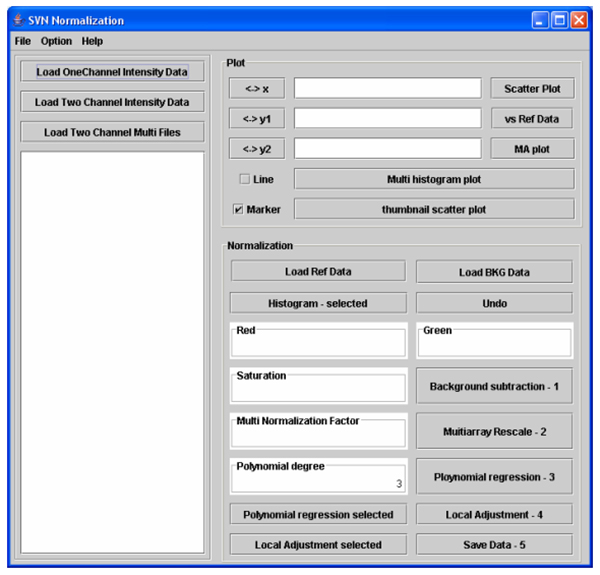
First Step: Background Subtraction
Select an array in scroll pane, then click “Background subtraction” button. For one channel data, it takes value in Red box. For two channels, it takes values in both red and green boxes. The values given in the boxes are in log2 intensity.
If one knows the background values for each of arrays, one may load that file by clicking “Load BKG data” button to have the background subtracted for all the arrays automatically.
Second Step: Multiarray Rescale
Click “Multiarray rescale” button to perform multiarray rescale. In the case of one channel data, it will first generate RefData which is the average values from all the loaded arrays, it then rescales each array against the RefData. If one has the RefData already and want to use it against the loaded array data, the RefData should be loaded by clicking “Load Ref Data” button before clicking “Multiarray rescale” button.
Third Step: Polynomial Regression.
Click “Polynomial regression” button to perform the regression of all the loaded array data. It takes degree value from “Polynomial degree” box. In the case of one channel data, it will perform regression of an array data against the refData.
After regression, the new regression line passes origin and has a slope of 1. One may perform regression to a selected array by clicking “Polynomial regression selected” button.
Forth Step: Local Adjustment
This is an optional operation. It may especially be useful when the polynomial regression does not appear optimal. Click “Local Adjustment” button to perform local adjustments. In the case of one channel data, it will perform the local adjustment of an array against the refData. One may perform local adjustment to a selected array by clicking “Local Adjustment selected” button.
Fifth Step: Save the Normalized Data
Click ”Save data” button to save the normalized data and the background subtraction values. In the case of one channel data, it also exports the refData.
In “Plot” panel, one may display scatter plot of log2 intensity or their histogram on selected arrays.