

Overview
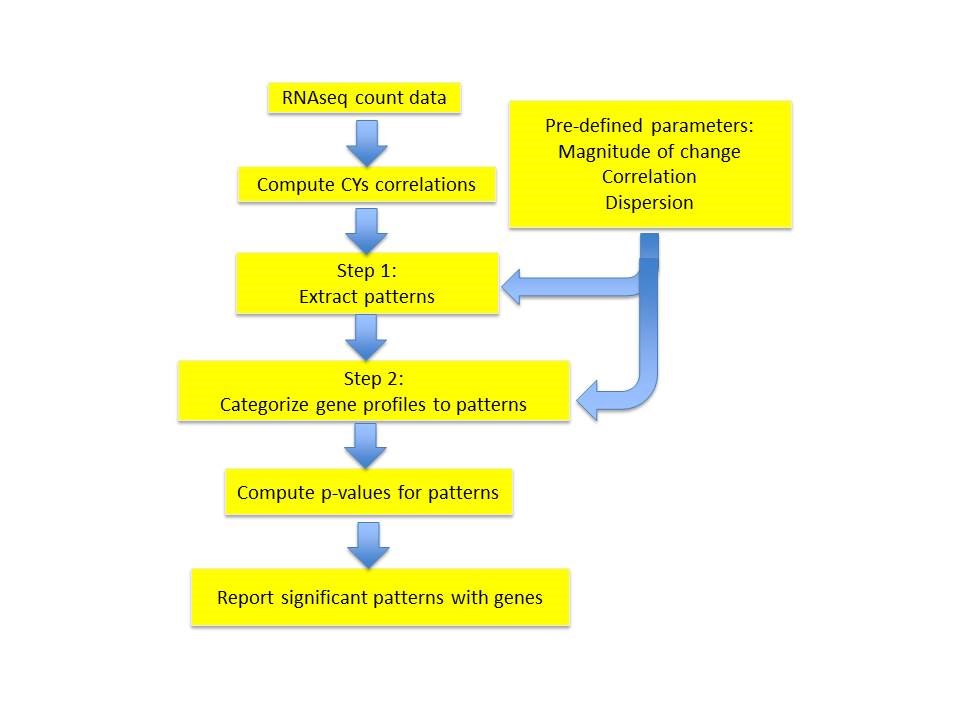
RNA-sequencing (RNA-seq) provides genome-wide representation of gene expression. RNA-Seq data is count-based rendering many normal distribution models for analysis inappropriate. Extracting patterns and identifying co-expressed genes (EPIG) for microarray data was adapted for RNA-seq (EPIG-Seq). To identify patterns, count-based correlation measures similarity between expression profiles, quasi-Poisson modelling estimates dispersion and a location parameter indicates the magnitude of differential expression. EPIG-Seq then categorizes genes to the patterns that they correlation with.
Workflow for EPIG-Seq
EPIG-Seq Implementation
Step 1: Pattern extraction
Correlation
A compiled RNA-seq gene expression dataset consists of a 2-dimensional matrix, in which each row represents a gene expression profile and each column represents a sample. Denote xij as the count of reads from sample j mapped to a gene i and xkj as the count of reads from sample j mapped to a gene k. To measure the count level correlation between two gene profiles, the similarity measure for count data previously defined as
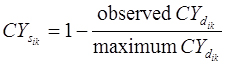
was adopted where
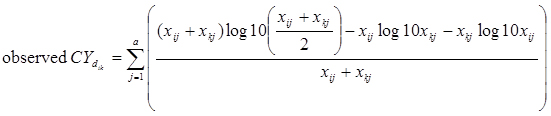
and a is the total number of samples with read counts mapped to either profile.
Magnitude of change
The strength of a gene expression profile’s signal is defined according to the value of the test-statistic location parameter obtained from a Wilcoxon rank sum non-parametric test measuring the difference between the ranks of the expression of the genes in sample X vs those in sample Y. Here, sample X is the biological replicates from the treated, perturbed or diseased group and sample Y is the biological replicates from the controls. The gth gene expression profile’s signal is therefore:
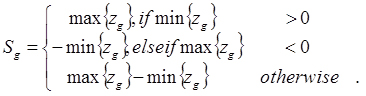
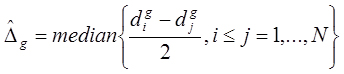
When the sample size for each group is small (i.e., ≤ 30), the estimation of the Z-statistic from the Wilcoxon rank sum test can be spurious. In such a case, the strength of the gth gene’s differential expression is the value of the Hodges-Lehmann location parameter estimator
for the difference between two groups. Briefly,
is the median of the Walsh averages; i.e., the average of all possible pairs of differences between the ranks of the gth gene RNA-Seq counts in sample X vs the ranks of the RNA-Seq counts in sample Y. Thus, for a set of N paired differences observations, there will be N(N+1)/2 Walsh averages. The median of all the Walsh averages is equal to

. Hence,
Dispersion
Count data is known to be dispersed. The variance-to-mean ratio (VMR) is a measure of dispersion (
) and is the inverse of signal to noise. If
is larger than 1, a data set is said to be overdispersed. For each gth gene expression profile,
is estimated using a quasi-Poisson regression to model the data. For Poisson distributed data, the variance is equal to the mean, i.e., V(Yg) = E(Yg) =

. The quasi-Poisson likelihood model is commonly used for overdispersed count data as it incorporates the dispersion parameter

into the Poisson model. In doing so, the variance of the response (Yg) is a linear function of the mean, V(Yg) =

and dispersion estimated as
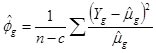
where n is the sample size, c is the number of estimated parameters and

is an inverse function of the linear predictors. Here, the inverse function is a “log” link in the form of a generalized linear model:
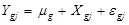
, where for the gth gene expression profile in the jth sample, Y is the read count, X is the independent variable and

is the random error term
Step 2: Categorization of gene expression profiles to patterns
Once the patterns have been extracted, the
measure is used to correlate the ith profile to the kth pattern. The profile is assigned to the pattern to which it has the highest similarity to. Once all the profiles are assigned, a representative profile for each of the patterns is determined by the highest median correlation to the other profiles in the pattern. Briefly, for the ith gene expression profile and for the kth pattern it is assigned to, a Pattern Correlation Score
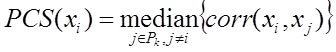
is computed as the median of the correlations among the ith profile (xi) to all other profiles (xj) assigned to pattern k (Pk). Until no more profiles are reassigned, the

measure is used to correlate the ith profile to the kth pattern and assign it to the pattern with which it has the highest correlation. Since the CYs does not denote the directionality of the correlation, the assignment of a profile is done if and only if, corr(ind(Zi),ind(Zj)) for all groups = 1. Here corr() is the Pearson correlation and ind() is the indication of + or – of the location parameter Z.
Reference for Citing
Li J, Bushel PR. EPIG-Seq: extracting patterns and identifying co-expressed genes from RNA-Seq data. BMC Genomics. 2016 Mar 22;17:255. [Abstract Li J, Bushel PR. EPIG-Seq: extracting patterns and identifying co-expressed genes from RNA-Seq data. BMC Genomics. 2016 Mar 22;17:255.]
Requirements
R version ≥ 3.1.2
CRAN R package stats version 3.1.2 to fit a generalized linear model (glm)
Matlab installation executable (MGLInstaller.exe) to install Matlab math libraries
epigseqgui.exe executable
EPIG-Seq is available at: SourceForge: EPIG-Seq
Report bugs, corrections and suggestions to Pierre Bushel at [email protected] and Jianying Li
Public Domain Notice
This is U.S. government work. Under 17 U.S.C. 105 no copyright is claimed and it may be freely distributed and copied.
Contact

Jianliang Li, Ph.D.
[email protected]