


Features
Highlights in Data Integration
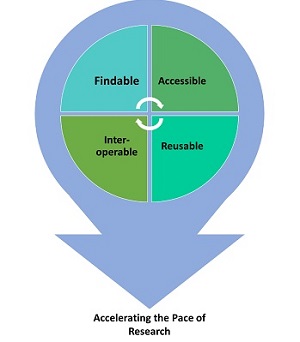
In 2019, the Superfund Research Program (SRP) funded data supplements to foster data sharing and enhance data integration within the program. SRP data supplements encourage the FAIR data principles which also align with NIH and NIEHS goals. Most prominently, the NIH Policy for Data Management and Sharing, which promotes the management and sharing of scientific data generated from NIH-funded or conducted research.
These supplements consisted of 19 collaborative Use Cases teams formed to improve the interoperability of SRP data across multiple centers, projects, and other public databases. The goal of the Use Case teams was to use the power of combining distinct datasets from different scientific disciplines to address complex research questions that could not be answered using only a single data stream.
Leveraging Data Across Populations
Collaborators at the Columbia University, University of California (UC), Berkeley, and University of New Mexico (UNM) SRP Centers sought to integrate their data to understand if arsenic measured in biological and environmental samples could be combined to get a more complete picture of exposure levels. They developed a common data dictionary, which collects key names, definitions, and attributes about specific data elements, and shared the code used to analyze and combine the exposure measurements taken across the three Centers via GitHub. This allowed the team to identify unique factors contributing to arsenic levels, such as eating fish or rice contaminated with arsenic, in three different human populations.
Researchers from UC Berkeley and Columbia University SRP Centers also worked together to combine data on arsenic and epigenetic changes, which alter the expression of genes, in different populations. Their goal was to identify whether epigenetic changes related to arsenic exposure are generalizable across study populations and, therefore, useful biological markers for understanding potential harm to human health. The team standardized their individual datasets, developed a standard process for analysis, and shared the results via GitHub to be openly used by the broader scientific community. A publication describing their findings is forthcoming.
Collaborative teams from the UNM, Dartmouth College, and Northeastern University SRP Centers integrated demographic information with chemical exposure data collected during pregnancy to better understand the role of combined exposures on birth outcomes. The team harmonized data dictionaries across three cohorts and developed a private Web platform for advanced statistical analysis. Instructions for how to use this application are shared on GitHub, making their process more FAIR. In the future, the team hopes to explore associations between arsenic exposure during pregnancy and gestational age and birth measurements.
Integrating Omics Data Across Model Organisms
SRP researchers from Michigan State University, University of Louisville (UL), University of Kentucky, and University of Iowa examined how data from laboratory-controlled animal studies can be used characterize the common molecular pathways linking exposures and disease. Combining complex toxicology data proved challenging, so the team focused on updating and strengthening a framework for data sharing. They also developed a web-application for finding, accessing, integrating, and reusing datasets in the Metabolomics Workbench data repository.
Researchers at Boston University (BU) and Oregon State University (OSU) SRP combined data on how different chemicals alter human and rodent cells, such as damaging DNA, and ways they alter zebrafish development and behavior.Together theysought touncover the underlying mechanisms by which exposure to chemicals harm health.They leveraged existing common vocabularies and developed twoportals, the Xposome Portal hosted at BU, and the SRP Data Analytics Portal hosted at OSU, to make their data accessible to outside users.
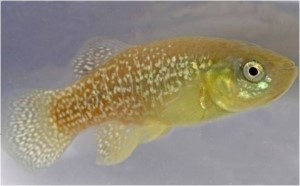
Collaborators at BU and Duke University SRP Centers leveraged their parallel projects exploring how two populations of Atlantic killifish evolved resistance to polycyclic aromatic hydrocarbons (PAHs) and polychlorinated biphenyls in their environment. Leveraging existing tools and data repositories, they developed SuperFunBase, a tool that can be used to link data in killifish with animal and human data. This will allow researchers to identify similar genes across species to help explain susceptibility versus resistance to hazardous substances.
Sharing Environmental Microbiome Data

Researchers from the University of Iowa and Duke University SRP Centers worked to combine high-throughput sequencing data that characterizes the microbiome of Superfund sediments. Their goal was to better understand and engineer microbes to clean up contaminants in the environment. They improved the reproducibility of their environmental sequencing data by standardizing their experimental and data analysis methods. The team also developed software that will allow anyone to replicate their analyses once publicly available.
University of Arizona (UA) and the University of California, San Diego (UCSD) SRP Centers combined data to identify interactions between metals, microbes, and plants that help some plants tolerate contaminants and stabilize metals in contaminated soils. In a closely related Use Case, researchers from the UA SRP Center and the Colorado School of Mines collaborated to explore how cleaning up mining waste affects diversity in terrestrial and aquatic systems. Both teams developed standard operating procedures for gathering, cleaning, and storing data. They also helped expand existing ontologies, such as the Environment Ontology, which provide more precise descriptions of the data. They are analyzing their combined data to reveal new insight in the mechanisms involved in resistance to pollution.
Geospatial Platforms and Visualization of Environmental Data
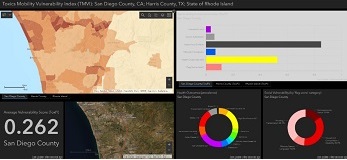
The Texas A&M University, Brown University, and UCSD SRP Center's Use Case team combined land use data, such as industrial land and green space, to understand the potential effect on people's exposure to harmful chemicals after an environmental disaster, such as flooding. Researchers worked with data scientists to integrate city, federal and SRP Center geospatial datasets from three different locations to create an online interactive map. With this tool, communities and decision makers can visualize how different factors, such as floodplain area and social factors, contribute to community vulnerability to contaminants, flooding, or health outcomes.
Researchers at the Dartmouth College SRP Center, Duke University, University of Maryland-Baltimore County, and the Smithsonian Environmental Research Center collaborated to examine the geochemical, biological, and ecological factors controlling mercury movement in aquatic environments. While initial plans included combining data from field studies with controlled lab experiments in a central data platform, challenges resulting from different naming conventions used across labs created a barrier. They addressed this by leveraging several existing vocabularies and by developing standard terms for naming data. These activities enabled them to harmonize data from five different laboratory and field studies in a database that they plan to make public.
Dartmouth College and BU SRP Centers created a searchable data platform that combines contaminant measurements from fish tissue and environmental data from Superfund sites with publicly available data from national water and fish surveys. They developed a new vocabulary to standardize data across sources and are planning to develop a public repository underpinning an interactive map, which will provide a broad view of fish contamination across the U.S.
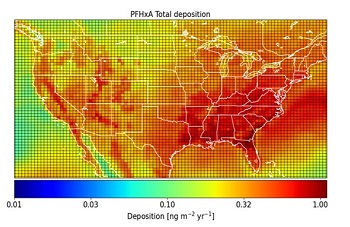
A Use Case between the University of Rhode Island and Massachusetts Institute of Technology (MIT) SRP Centers set out to obtain more information on the link between sources of per- and polyfluoroalkyl (PFAS) and PAH emissions and concentrations in the environment. The researchers designed an approach to store and organize the data, while leveraging existing ontologies to integrate it. Using GEOS-Chem, a global 3-D model of atmospheric chemistry available on GitHub, they transformed their data into 3-D chemical models that link emissions of pollutants into the atmosphere, chemical transformations, and movement back to land. The team hopes to make their modeling process available online so community partners can explore data in an accessible, interactive, and visual format and become better informed about sources of pollution.
Data Sharing Tools, Workflows, and Platforms
Researchers from Columbia University, Dartmouth College, UA, and UNM SRP Centers worked on a Use Case to determine how data collected using an advanced tool, called a synchrotron, can be reused by others and integrated to study how environmental contaminants move in the environment and change their toxicity. Synchrotrons use electrons to create beams of light that analyze samples and provide detailed information about different forms of chemicals present. The team created a tool, called the Biological Elemental Imaging Database, to make analyses more uniform and to conduct automated quality checks on submitted data. Through their collaboration, the researchers uncovered new information about factors that control arsenic levels and toxicity in rice, such as levels of iron and zinc in environmental samples and plant tissue.
Duke University and the University of California, Davis (UCD) SRP Centers worked with a collaborator from the U.S. Environmental Protection Agency (EPA) to develop a tool to improve sharing and analyzing high-resolution mass spectrometry data. The team developed a standard data format by creating an open-source platform to store mass spectral data from online repositories. Using water quality data collected by Duke SRP Center researchers after Hurricane Florence in 2018, they determined necessary steps to improve access to their data and help identify the potential health risk of unknown compounds in environmental samples after natural disasters.
Researchers from UCD and UCSD SRP Centers explored how to re-use their existing datasets to improve their biosensor probes used to detect chemicals in the environment. The team developed rules for entering and formatting data and established protocols to improve data quality and shareability. The researchers combined their data in one platform, housed at the UCSD SRP Center, and will develop websites to make their data publicly available when completed.

MIT and UNM SRP Center researchers worked together to merge information on DNA damage across rodent and human cells. The researchers integrated their existing datasets obtained from the CometChip assay, a tool developed by researchers at MIT to measure DNA damage in cells exposed to different contaminants. Using machine learning, they improved the efficiency of the tool by eliminating the need to hand-process raw data for analysis. They also stored their metadata in an MIT repository called MIT SEEK, created ontologies to better describe the CometChip assay, and adapted their software for automated data formatting. This will allow other investigators to analyze and share CometChip data more easily.
A team across the UNM and UL SRP Centers set out to develop a platform to store and exchange data obtained by flow cytometry, a technique used to detect and measure characteristics of cells. Specifically, they aimed to better understand the effects of chemical exposures on circulating blood cells that cause immune injury or cardiovascular disease, but this type of data is complex and experimental approaches vary across labs. The researchers created standard methods for collecting and entering data and created a template to share data via a publicly-available UNM data portal. These strategies allowed the team to successfully convert some of their datasets into a format that can be analyzed by others. The team hopes to generate new findings by integrating data on different cell groups and chemical exposures in the future.
to Top