Overview
EPIG is a method for Extracting microarray gene expression Patterns and Identifying co-expressed Genes. Through evaluation of the correlations among profiles, the magnitude of variation in gene expression profiles, and profile signal-to-noise ratios, EPIG extracts a set of patterns representing co-expressed genes without a pre-defined seeding of the patterns.
Method
A compiled microarray gene expression data set (conventionally presented, the log2 pixel intensity ratio values) consists of a 2-dimensional matrix, in which each row represents a gene expression profile and each column represents an array. Upon sample perturbation or variation in biological factors, such as agent, dose, time or tissue, a gene expression profile can be made up of inter-group and intra-group samples. The arrays in an intra-group sample have a factor in common, e.g. biological replicates. The arrays in inter-group samples possess different factors, e.g., sham-treatment and time points post-UV or IR treatment. Each datum of log2 ratio is denoted as gij in a gene expression profile, where i refers to a inter-group index from 1 to m, j is the intra-group index from 1 to ni, m is the number of inter-groups and ni is the number of arrays in ith inter-group. To evaluate such a profile, each intra-group average and sample variance are computed. A gene expression profile’s signal is defined as
where 1 ≤ i ≤ m.. A profile’s noise estimate is defined as the square-root of the pooled variance, i.e.
where the sample variance
From Equations 1 and 2, a profile’s signal-to-noise ratio is defined as
When m = 1, Equation 3 is equivalent to a two sample t-test, since by default the log2 pixel intensity ratio is the treated against its control. Equation 3 includes the case for m > 1, i.e. multiple inter-groups.
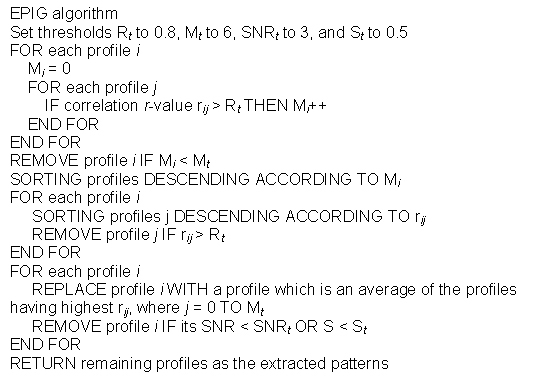
In extracting gene expression patterns, EPIG uses a filtering process where all profiles initially are considered as pattern candidates. The following is the pseudo code for the algorithm:
Briefly, using all pair-wise correlations, any candidate profile, whose local cluster size is less than a predefined size Mt or its correlation with another profile is higher (> Rt) but has a lower local cluster size M, is removed from pattern construction consideration. Among the remaining profiles, EPIG then creates representative profiles for the corresponding local clusters and removes those profiles with a SNR in Equation 3 less than 3 or magnitude S in Equation 1 less than 0.5. After this filtering processing, the remaining profiles consist of the extracted patterns, which are used to be the representatives to each of the local clusters.
Each of the patterns has the highest local cluster size in comparison with other highly similar profiles (e.g. correlation larger than 0.8) in the same local cluster. Subsequently, EPIG categorizes each gene to the pattern, for which it has the highest correlation with the gene profile. A gene not assigned to any extracted patterns is considered an “orphan” if its highest correlation r-value is lower that a given threshold Rc. Typically Rc is set to a value which corresponds to a correlation p-value of 10-4 to assure the significance of the co-expression.
Requirements
The software has been tested to run on Windows PCs running the 2000 and XP operating systems and requires JRE version 1.4.2
Downloads
- Download the EPIG archive (1MB)
- Quick Start Guide
- Report bugs, corrections and suggestions to [email protected]
Public Domain Notice
This is U.S. government work. Under 17 U.S.C. 105 no copyright is claimed and it may be freely distributed and copied.
Contact
-
Pierre R. Bushel, Ph.D.
Special Volunteer -
Tel 919-618-1945
[email protected]


