


Details of Current Models
The datasets (i.e., components) comprising models 11.2 and 12.4 are described below. The main difference between the models is the inclusion of vaccination data (and subsequent re-weighting) in model 12.4. For both models, each component is assigned to an indicator (data slice) categorized into four domains: Infection Rate, Population Concentration, Intervention Measures, and Health & Environment. The expanded tables include a description of each component, the rationale for its inclusion, and a link to the public data source. Details of the methods used to build and assess the PVI are provided below.
The time-series data underlying the current model are available at github.com/COVID19PVI/data. The software used to generate PVI scores and profiles from these data is freely available at toxpi.org.
The PVI was developed to summarize and communicate complex, high-dimensional data related to communities’ vulnerability to COVID-19. The corresponding scorecards are human-centric and focus on impacts at the community level. Accordingly, data were apportioned into slices using a combination of quantitative modeling and prior knowledge of risk drivers.
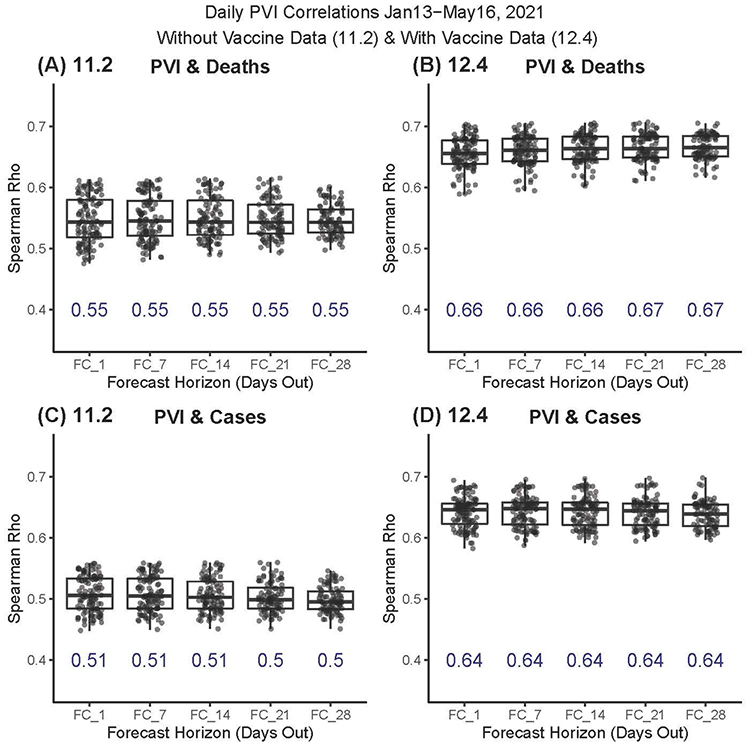
To gauge the association of daily PVI values compared with cumulative death and case numbers, the rank-correlation between overall PVI values and the key vulnerability-related outcome metrics of cumulative deaths (Figure 1A/B) and cumulative cases (Figure 1C/D) was compared. The Spearman Rho values for the PVI (from January 13 through May 16, 2021) compared to outcomes 1, 7, 14, 21, and 28 days ahead of a given date are displayed. All daily rank-correlation estimates were highly significant (all P -values < 1e-14). The mean Rho values for each time horizon are displayed in blue text.
While the general PVI model communicates an integrated concept of vulnerability, purpose-built forecasting models were used to predict case and death numbers. Predictive modeling for both COVID-19 cases and deaths presents several unique challenges. Unlike other airborne viruses (e.g., influenza), testing methods and best medical practices for this contagion quickly evolved during the pandemic. Tests were initially limited to those presenting severe symptoms, testing practices differed by geographic region, and testing became more widely available as the pandemic progressed and resources became available. As a result, it is difficult to compare the observed number of cases per population and deaths per case across time or geographic areas. To accurately predict future cases and deaths, it was necessary to account for the fluid nature of the data.
Accordingly, the team developed a Bayesian spatiotemporal random-effects model that jointly describes the log-observed and log-death counts to build local forecasts. In this model, log-observed cases for a given day are predicted using known covariates (e.g., population density, social distancing metrics), a spatiotemporal random-effect smoothing component, and the time-weighted average number of cases for these counts. This smoothed time-weighted average is related to a Euler approximation of a differential equation; it provides modeling flexibility while approximating potential mechanistic models of disease spread. The smoothed case estimates are used in a similar spatiotemporal model to predict future log-death counts based on a geometric mean estimate of the number of observed cases for the previous seven days as well as other data streams. Figure 1 displays the resulting county-level predictions and corresponding confidence intervals.
Details of Model (11.2)
| Data Domain (% weight) Data Slice (% weight) Component(s) |
Update Freq. | Description/Rationale | Source(s) | |
|---|---|---|---|---|
| Infection Rate (24%) | ||||
| Transmissible Cases (20%) | ||||
| Daily | Population size divided by cases from the previous 14 days. The cases identified in the 14-day incubation period are the most likely to be transmissible. This metric is the number of “contagious” individuals relative to the population. A higher number indicates a higher likelihood of continued spread of infection. | USA Facts | ||
| Disease Spread (4%) | ||||
| Daily | Fraction of total cases that are from the previous 14 days (i.e., incubation period). A sustained decline in new infections over the previous 14 days signals a reduction in the spread of infection. This metric is a value between 0 and 1, with values near 1 occurring in an exponential growth phase. Values decline linearly to zero over 14 days if there are no new infections. | USA Facts | ||
| Population Concentration (16%) | ||||
| Population Mobility (8%) | ||||
| Daytime Population Density | Static | Estimated daytime population. A higher daytime population density is expected to increase the spread of infection because more people are in proximity to each other. | The field “DPOPDENSCY” (2019 Daytime Pop Density) from ESRI demographics analysis of American Community Survey data 2018 CDC Social Vulnerability Index (adjunct variable) |
|
| Baseline Traffic | Static | Average traffic volume per meter of major roadway in the county from 2018 EPA EJSCREEN. Higher traffic volume is expected to increase the spread of infection due to greater movement and interaction of people. | 2020 County Health Rankings | |
| Residential Density (8%) | ||||
| Residential Density | Static | Integrated data from the 2014-2018 ACS on families living in multi-unit structures or mobile homes, over-crowding (more people than rooms), being without a vehicle, and persons in institutionalized group quarters. All of these variables are associated with higher residential density, which is expected to increase the spread of infection because more people are in proximity to each other. | 2018 CDC Social Vulnerability Index (SVI Housing Type & Transportation Theme) | |
| Intervention Measures (16%) | ||||
| Social Distancing (8%) | ||||
| Daily | Unacast social distancing scoreboard grade assigned by comparing the change in overall distance travelled and the change in nonessential visits relative to a baseline (previous year), based on cell-phone mobility data. The grade is converted to a numerical score, with higher values indicating less social distancing (a lower score), which is expected to increase the spread of infection because more people are interacting with each other. | Unacast | ||
| Testing (8%) | ||||
| Daily | Population divided by the number of tests performed (state-wide statistics). This is the inverse of the number of tests per population. A higher number indicates less testing. A lower testing rate indicates a higher likelihood of undetected infections, which is expected to increase the spread of infection. | The COVID tracking project | ||
| Health & Environment (44%) | ||||
| Population Demographics (8%) | ||||
| % Black | Static | Percentage of the population who self-identify as Black or African American. | 2018 Census Population Estimates from CHR (County Health Rankings and Roadmaps) | |
| % Native | Static | Percentage of the population who self-identify as American Indian or Alaska Native. | 2018 Census Population Estimates from CHR (County Health Rankings and Roadmaps) | |
| Air Pollution (8%) | ||||
| Static | Average daily density of fine particulate matter in micrograms per cubic meter (PM2.5) from 2014 Environmental Public Health Tracking Network. Air pollution has been associated with more severe outcomes from COVID-19 infection. | Air Pollution-Particulate Matter | ||
| Age Distribution (8%) | ||||
| % age 65 and over | Static | Aged 65 or older from 2014-2018 ACS. Older age has been associated with more severe outcomes from COVID-19 infection. | 2018 CDC Social Vulnerability Index | |
| Co-morbidities (8%) | ||||
| Premature death | Static | Years of potential life lost before age 75 years per 100,000 population (age-adjusted) based on 2016-2018 National Center for Health Statistics - Mortality Files. This is a broad measure of health and is a proxy for cardiovascular and pulmonary disease, which has been associated with more severe outcomes from COVID-19 infection. | 2020 County Health Rankings | |
| Smoking | Static | Percentage of adults who are current smokers from 2017 Behavioral Risk Factor Surveillance System. Smoking has been associated with more severe outcomes from COVID-19 infection and causes cardiovascular and pulmonary disease. | 2020 County Health Rankings | |
| Diabetes | Static | Percentage of adults aged 20 years and above with diagnosed diabetes from 2016 United States Diabetes Surveillance System. Diabetes has been associated with more severe outcomes from COVID-19 infection. | 2020 County Health Rankings | |
| Obesity | Static | Percentage of the adult population (aged 20 years and older) with a body mass index (BMI) greater than or equal to 30 kg/m2. Obesity has been associated with more severe outcomes from COVID-19 infection. | 2020 County Health Rankings | |
| Health Disparities (8%) | ||||
| Uninsured | Static | Percentage uninsured in the estimated total civilian noninstitutionalized population from 2014- 2018 ACS. Individuals without insurance are more likely to be undercounted in infection statistics and may have more severe outcomes due to lack of treatment. | 2018 CDC Social Vulnerability Index | |
| SVI Socioeconomic Status | Static | Integrated data from 2014-2018 ACS on the percentage of individuals living below the poverty line, percentage unemployed (historical), income, and percentage without a high school diploma. Individuals with lower socioeconomic status are more likely to be undercounted in infection statistics and may have more severe outcomes due to lack of treatment. | 2018 CDC Social Vulnerability Index (SVI Socioeconomic Status score) | |
| Hospital Beds (4%) | ||||
| Static | Summation of hospital beds for hospitals with “OPEN” status and “GENERAL MEDIAL AND SURGICAL” description. | Homeland Infrastructure Foundation-Level Data (HIFLD) | ||
Details of Model (12.4)
| Data Domain (% weight) Data Slice (% weight) Component(s) |
Update Freq. | Description/Rationale | Source(s) | |
|---|---|---|---|---|
| Infection Rate (25%) | ||||
| Transmissible Cases (20%) | ||||
| Daily | Cases from the previous 14 days divided by population size. Cases identified during the 14-day incubation period are the most likely to be transmissible. This metric is the number of “contagious” individuals relative to the population. A higher number indicates a higher likelihood of continued spread of infection. | USA Facts | ||
| Disease Spread (5%) | ||||
| Daily | Fraction of total cases from the previous 14 days (i.e., incubation period). A sustained decline in new infections over the previous 14 days signals a reduction in the spread of infection. This metric is a value between 0 and 1, with values near 1 occurring during an exponential growth phase. Values decline linearly to zero over 14 days if there are no new infections. | USA Facts | ||
| Population Concentration (15%) | ||||
| Population Mobility (10%) | ||||
| Daytime Population Density | Static | Estimated daytime population. Higher daytime population density is expected to increase the spread of infection because more people are in proximity to each other. | The field “DPOPDENSCY” (2019 Daytime Pop Density) from ESRI demographics analysis of American Community Survey data 2018 CDC Social Vulnerability Index (adjunct variable) |
|
| Baseline Traffic | Static | Average traffic volume per meter of major roadway in the county from 2018 EPA EJSCREEN. Higher traffic volume is expected to increase the spread of infection due to greater movement and interaction of people. | 2020 County Health Rankings | |
| Residential Density (5%) | ||||
| Residential Density | Static | Integrated data from the 2014-2018 ACS on families living in multi-unit structures or mobile homes, over-crowding (more people than rooms), being without a vehicle, and persons in institutionalized group quarters. All of these variables are associated with higher residential density, which is expected to increase the spread of infection because more people are in proximity to each other. | 2018 CDC Social Vulnerability Index (SVI Housing Type & Transportation Theme) | |
| Intervention Measures (25%) | ||||
| Vaccines (15%) | ||||
| Daily | Percentage of unvaccinated residents. The spread of infection is reduced with fewer unvaccinated individuals. | HHS Community Profile Reports | ||
| Social Distancing (5%) | ||||
| Daily | Unacast social distancing scoreboard grade assigned by comparing the change in overall distance travelled and the change in nonessential visits relative to a baseline (previous year), based on cell-phone mobility data. The grade is converted to a numerical score, with higher values indicating less social distancing (a lower score), which is expected to increase the spread of infection because more people are interacting with each other. | Unacast | ||
| Testing (5%) | ||||
| Daily | Population divided by the number of tests performed (state-wide statistics). This is the inverse of the number of tests per population. A higher number indicates less testing. A lower testing rate indicates a higher likelihood of undetected infection, which is expected to increase the spread of infection. | HHS Community Profile Reports | ||
| Health & Environment (35%) | ||||
| Hospital Beds (10%) | ||||
| Daily | Summation of hospital beds for hospitals with “OPEN” status and “GENERAL MEDIAL AND SURGICAL” description. | HHS Community Profile Reports | ||
| Hospital Ventilators (10%) | ||||
| Daily | Percentage of ventilators in use. The percentage of ventilators across all medical facilities being used for patients with any medical condition. | HHS Community Profile Reports | ||
| Population Demographics (3%) | ||||
| % Black | Static | Percentage of the population who self-identify as Black or African American. | 2018 Census Population Estimates from CHR (County Health Rankings and Roadmaps) | |
| % Native | Static | Percentage of the population who self-identify as American Indian or Alaska Native. | 2018 Census Population Estimates from CHR (County Health Rankings and Roadmaps) | |
| Air Pollution (3%) | ||||
| Static | Average daily density of fine particulate matter in micrograms per cubic meter (PM2.5) from 2014 Environmental Public Health Tracking Network. Air pollution has been associated with more severe outcomes from COVID-19 infection. | Air Pollution-Particulate Matter from CHR (County Health Rankings and Roadmaps) | ||
| Age Distribution (3%) | ||||
| % age 65 and over | Static | Aged 65 years or older from 2014-2018 ACS. Older age has been associated with more severe outcomes from COVID-19 infection. | 2018 CDC Social Vulnerability Index | |
| Co-morbidities (3%) | ||||
| Premature death | Static | Years of potential life lost before age 75 years per 100,000 population (age-adjusted) based on 2016-2018 National Center for Health Statistics - Mortality Files. This is a broad measure of health and is a proxy for cardiovascular and pulmonary disease, which has been associated with more severe outcomes from COVID-19 infection. | 2020 County Health Rankings | |
| Smoking | Static | Percentage of adults who are current smokers from 2017 Behavioral Risk Factor Surveillance System. Smoking has been associated with more severe outcomes from COVID-19 infection and causes cardiovascular and pulmonary disease. | 2020 County Health Rankings | |
| Diabetes | Static | Percentage of adults aged 20 years and above with diagnosed diabetes from 2016 United States Diabetes Surveillance System. Diabetes has been associated with more severe outcomes from COVID-19 infection. | 2020 County Health Rankings | |
| Obesity | Static | Percentage of the adult population (age 20 and older) with a body mass index (BMI) greater than or equal to 30 kg/m2. Obesity has been associated with more severe outcomes from COVID-19 infection. | 2020 County Health Rankings | |
| Health Disparities (3%) | ||||
| Uninsured | Static | Percentage uninsured in the total civilian noninstitutionalized population estimate, 2014- 2018 ACS. Individuals without insurance are more likely to be undercounted in infection statistics and may have more severe outcomes due to lack of treatment. | 2018 CDC Social Vulnerability Index (adjunct variable) | |
| SVI Socioeconomic Status | Static | Integrated data from 2014-2018 ACS on the percentage of individuals living below the poverty line, percentage unemployed (historical), income, and percentage without a high school diploma. Individuals with lower socioeconomic status are more likely to be undercounted in infection statistics and may have more severe outcomes due to lack of treatment. | 2018 CDC Social Vulnerability Index (SVI Socioeconomic Status score) | |
Are You Ready to Get Started?
Visit the COVID-19 Pandemic Vulnerability Index (PVI) Dashboard