

By Brea Watkins
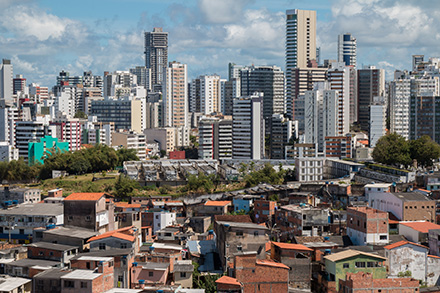
About 55% of the global population lives in cities , where wealthy and poor communities often dwell side by side. Visual information from city streetscapes - the collection of buildings, vegetation, and other features that align roadways - can provide insight into urban socioeconomic and environmental inequalities. For example, high- and low-income neighborhoods can differ in tree canopy cover, access to walking and cycling infrastructure, and quality and condition of buildings.
To date, however, research is lacking on how visual attributes between wealthy and poor areas compare across cities and countries. Understanding their similarities and differences from a streetscape perspective can inform approaches to reducing urban socioeconomic and environmental inequalities, found Esra Suel, Ph.D. from University College London and co-investigators.
How wealth manifests in photographs across continents also has implications for research that relies on image data to draw conclusions, they wrote. For example, computer algorithms that learn to identify signs of wealth using streetscape imagery from one country may not be appropriate for a research project studying urban inequality in another country.
"A comparative understanding of cities enabled by recent modelling and data technologies may help us design effective interventions across place and time and reverse negative trends in urban planning," said Esra Suel.
Urban planning has led to negative trends such as gentrification and displacement, as well as increased income inequality and negative public health outcomes for those who are forced to move.
Finding the Gaps: New Computation Approaches
There is still much work to be done in understanding the potential biases in artificial intelligence (AI) and computer modelling, as well as, how we can use AI methods most effectively, and where it is applicable to combine AI with more traditional methodologies. The first step is to find the data gaps and determine what information is needed to provide accurate measurements for computer modelling technologies.
Suel is part of an international, multi-partner project called Pathways to Equitable Health and Cities which investigates how urban development can improve public health equity. As part of that project, and with funding from a UK Medical Research Council Grant, Suel wanted to better understand how urban inequality manifests in streetscape imagery across continents.
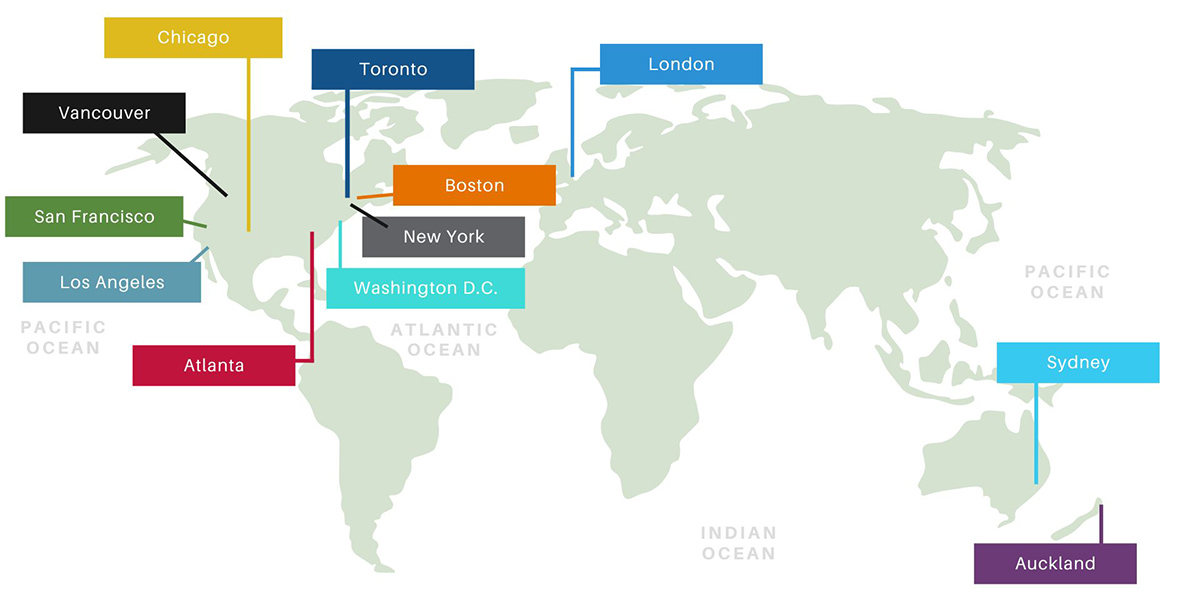
For their study, Suel and colleagues chose 12 cities in five countries: Auckland, New Zealand; Sydney, Australia; Toronto and Vancouver in Canada; London, England; and Atlanta, Boston, Chicago, Los Angeles, New York, San Francisco, and Washington D.C., in the United States. (Image courtesy of Esra Suel)
Across cities, they analyzed more than seven million street images publicly available from Google Street View , , tagging each one with a geographical marker linking it to a census tract. They also gathered household income data corresponding to each tract, further dividing it into sections ranging from highest to lowest income level.
Then, for a given city, they trained a computer model to learn which visual features in local streetscape photos were associated with different levels of income. Next, they tested the model's ability to predict wealth in the other cities using streetscape photos from those locales. They repeated this process for each of the 12 cities. They also conducted a version of that process within each city, training the model with a subset of images. These processes are considered Deep Learning, which is a subset of machine learning by AI.
Assessing Cities' Similarities and Differences
"We used deep learning to automatically learn visual environmental features, such as ones relating to the condition of buildings and density of cars, associated with wealthier and poorer areas," explained Suel. "We thought it might be similar to how we as humans make assumptions about the socioeconomic status of a neighborhood, even if it's a place we haven't visited."
Overall, the team found that the wealthiest neighborhoods look relatively similar across countries, while disenfranchised neighborhoods were more distinctive. Well-off residents can afford to live in neighborhoods with better amenities, the authors noted, and as a result, their communities share visual similarities. The team also suggested that high-income neighborhoods may aspire to a generic ideal of wealth, with well-maintained homes, for instance.
Wealth across North American cities was found to share even more similarities. The authors hypothesize this is a result of trends like white flight across the continent, where white residents fled cities when they faced an influx of migration from people of color, most notably in the mid-20th century.
The poorest areas in all cities showed signs of disrepair and poor condition of pavements, roads, homes, and gardens, but they differed in other features, such as building design, the authors observed. For example, images of poorly maintained social housing and tower blocks indicated overcrowding and poverty in London and Toronto, they noted, whereas lower-income areas in Atlanta were characterized by lower density and lower accessibility.
The findings have implications for research that relies on image-based measures of inequality, the authors said, suggesting that more attention should be paid to capturing variation among low-income neighborhoods across the globe.
"Our study highlights how there's no ‘one-size-fits-all' solution to alleviating urban inequality," Suel added.
Suel hopes that further research will improve experts and policymakers' ability to effectively utilize emerging data and modelling technologies when planning urban environments. As the effects of climate change continue, this work is important for a livable and equitable future.
NIEHS Research on Streetscapes, Urban Environments, and Artificial Intelligence
NIEHS has a wealth of research on city demographics and a variety of possible exposures in urban settings. Recently highlighted by NIEHS is:
- In this podcast episode, NIEHS-funded researcher Aruni Bhatnagar, Ph.D., talks about the effect of green space on public health.
- This Global Environmental Health newsletter article highlights the importance of urban design on children's health and well-being.
NIEHS is also engaged in the conversation around emerging AI technologies:
- In June 2023, NIEHS funded a panel discussion about the power of AI - and the need for ethical and accurate models of AI.
- NIH has established the Bridge to Artificial Intelligence ( Bridge2AI ) to fill in the gaps in biomedical and behavioral data for AI to use as Deep Learning.