A new model for tracking temperatures demonstrates how research conducted by the NIEHS Division of Translational Toxicology (DTT) directly benefits communities.
Using a network of personal weather stations already collecting real-time data, DTT scientists developed a model that precisely maps temperatures in city neighborhoods. This capability will help researchers better understand the relationship between extreme heat and health outcomes, and support efforts to reduce heat-related risks.
“This work provides an innovative platform for understanding how weather-related stressors and other environmental factors interact to affect human well-being,” said DTT Scientific Director Heather Patisaul, Ph.D. “By making the model publicly available, the team has enabled others working on the exposome to leverage knowledge gained from using this research to improve public health.”
A collaborative approach
The project reflects the DTT team science approach, which brings together specialists from different research backgrounds to devise innovative methods and solutions.

Kyle Messier, Ph.D., who leads the Spatiotemporal Exposures and Toxicology Group at NIEHS, specializes in developing geospatial models that show how environmental factors influence health across regions and over time. Although he primarily focuses on chemical exposures, when Eva Marquès, Ph.D., a recent postdoctoral fellow at NIEHS, approached him with an idea to develop heat models for U.S. cities, Messier embraced the idea. Marquès had focused her academic research on urban weather conditions and the generation of heat stress models for cities in Europe.
“It seemed like a natural step because we take an exposomics approach to research,” Messier said. “We work to understand how exposure to everything under the sun affects health over a lifetime.”
Practical applications
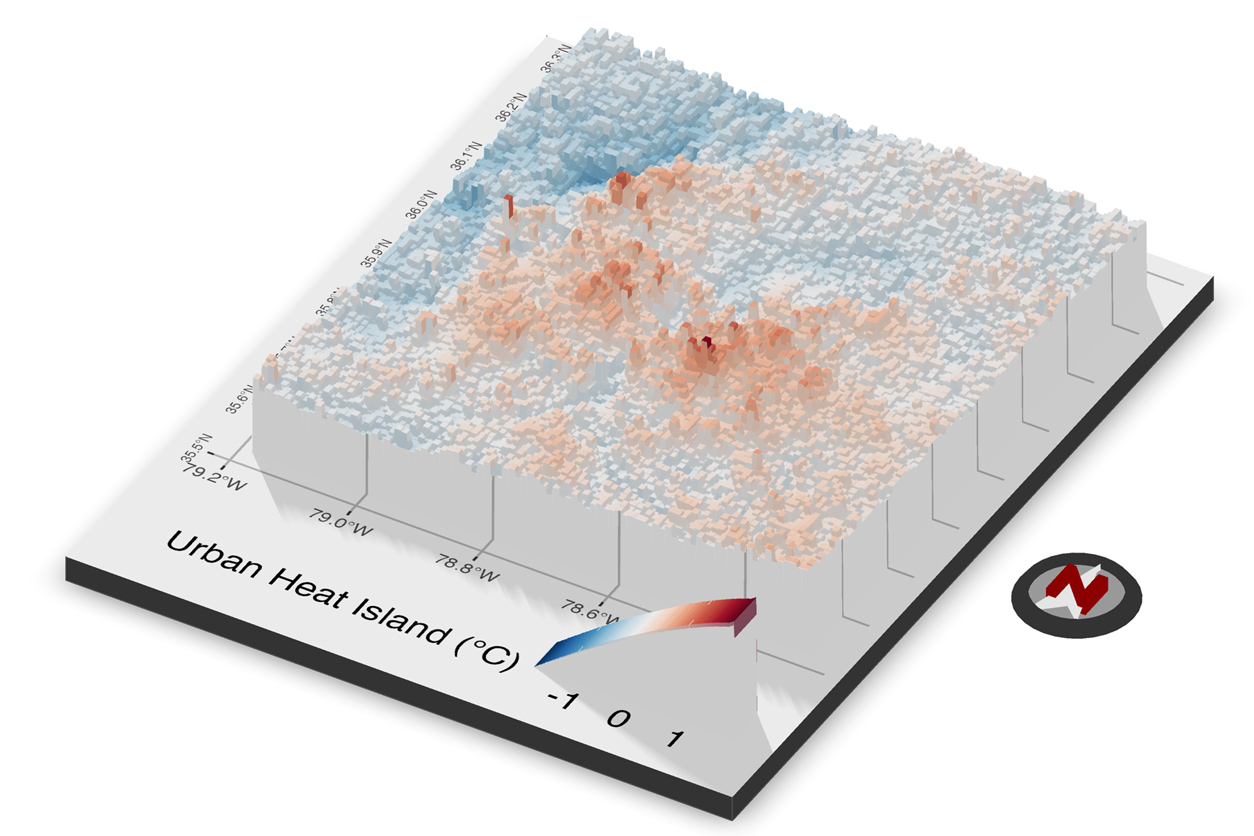
The collaboration enabled Messier and Marquès to collect hourly readings of air temperature from weather monitoring stations embedded in neighborhoods in New York City, Philadelphia, Phoenix, and Raleigh-Durham, North Carolina. Their model mapped temperature variations across both time and space, identifying urban heat islands, which are areas where city landscapes amplify heat compared with surrounding regions.

Messier noted that the model complements ongoing efforts, such as the National Institutes of Health All of Us Research Program and the Personalized Environment and Genes Study. Both initiatives compile large datasets with the goal of understanding how environmental factors, lifestyle, and genetics interact to influence health. Integrating temperature data will allow researchers to better evaluate the role of heat stress over time and guide public health strategies.
“Our approach reveals hotspots where attention is needed,” said Marquès, who now works for a French meteorological center. “The data can support actions like heat awareness campaigns, guide construction methods and park development, and inform other strategies to improve the urban environment and reduce health risks.”
Spreading the benefits
To maximize the scientific and policy potential of their research, Messier and Marquès prioritized making their data and model accessible and reproducible.
“We’ve put a lot of effort into ensuring it can be run and integrated into other studies,” said Messier. “It’s tested, documented, and accessible for other scientists and analysts to make their own calculations.”
In support of the manuscript, the team made predictions for the largest 100 U.S. urban areas, which is publicly available at the Harvard Dataverse.
(Douglas Murphy, Ph.D., is a technical writer-editor in the NIEHS Office of Communications and Public Liaison.)